Documento original
GPT Image 2 · en
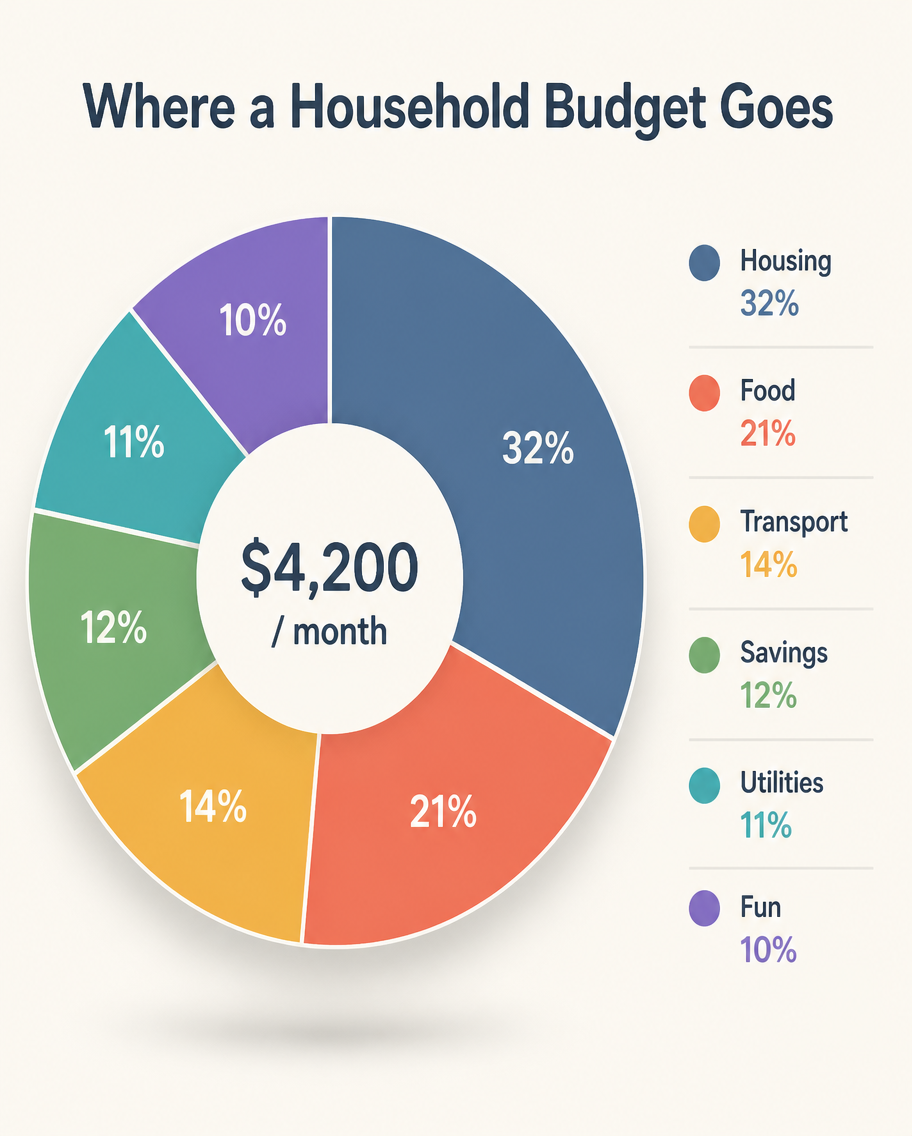
A minimalist infographic, 4:5, titled 'Where a Household Budget Goes'. A large centered donut chart splits monthly spending into six segments: Housing 32% (slate blue), Food 21% (coral), Transport 14% (amber), Savings 12% (green), Utilities 11% (teal), Fun 10% (violet). The donut's hollow center shows total '$4,200 / month'. A neat legend with color dots and labels sits to the right. Soft off-white background, thin dividing lines, rounded sans-serif type, subtle drop shadow under the donut, tidy modern layout.Como usar
- Copie o prompt original completo, incluindo os parâmetros.
- Adapte o tema, o texto e a composição aos seus requisitos.
- Use uma ferramenta externa compatível; confira o acesso e o resultado.
Antes de começar
- Verifique se é necessária uma imagem de referência. Compatibilidade não comprova qual modelo gerou o exemplo.
- Confira nomes, números e textos; os resultados variam entre versões do modelo.