原文
GPT Image 2 · en
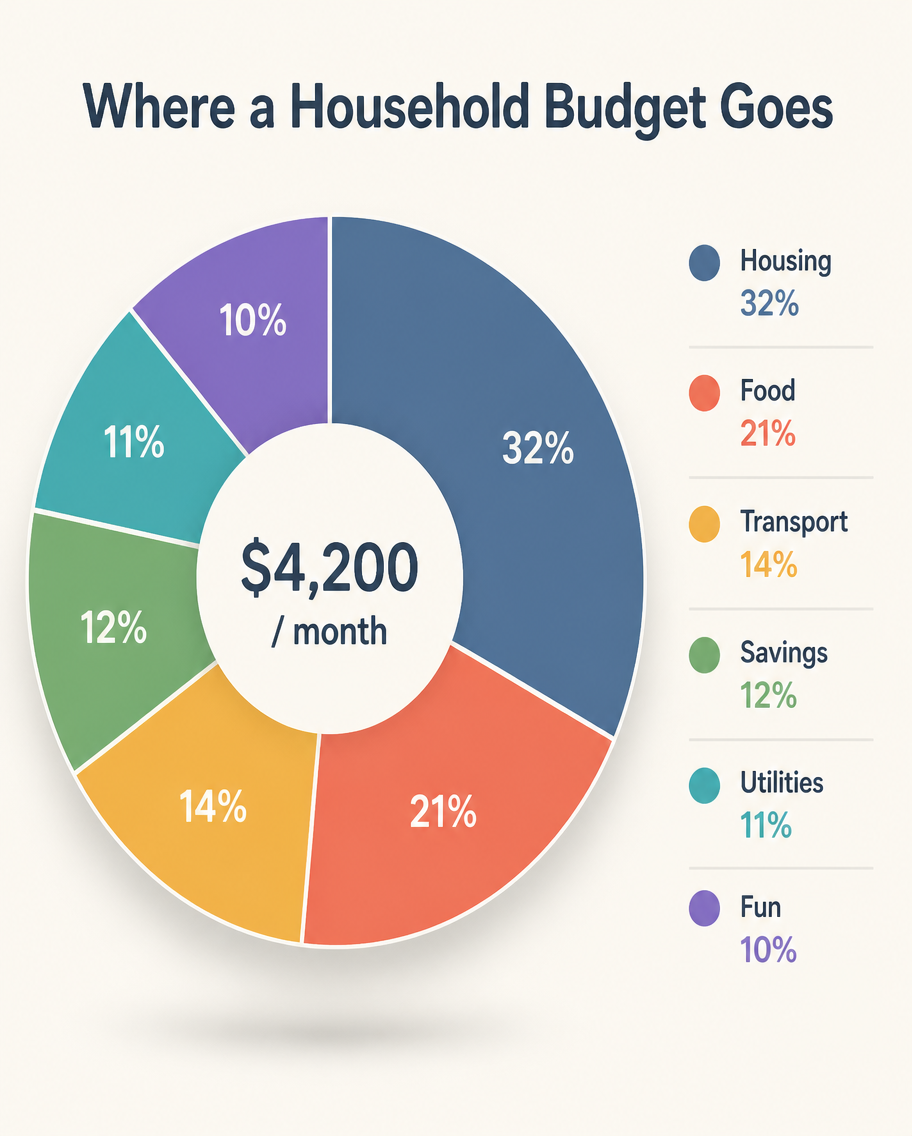
A minimalist infographic, 4:5, titled 'Where a Household Budget Goes'. A large centered donut chart splits monthly spending into six segments: Housing 32% (slate blue), Food 21% (coral), Transport 14% (amber), Savings 12% (green), Utilities 11% (teal), Fun 10% (violet). The donut's hollow center shows total '$4,200 / month'. A neat legend with color dots and labels sits to the right. Soft off-white background, thin dividing lines, rounded sans-serif type, subtle drop shadow under the donut, tidy modern layout.使い方
- パラメータを含む元のプロンプト全体をコピーします。
- 被写体、文字、構図を自分の要件に置き換えます。
- 対応する外部ツールで使用し、利用条件と結果を確認します。
開始前の確認
- 参考画像の要否を確認してください。互換モデルの表示は、そのモデルでの生成実績を意味しません。
- 名前、数値、画像内の文字を確認します。モデルの版で結果は変わります。