Documento originale
GPT Image 2 · en
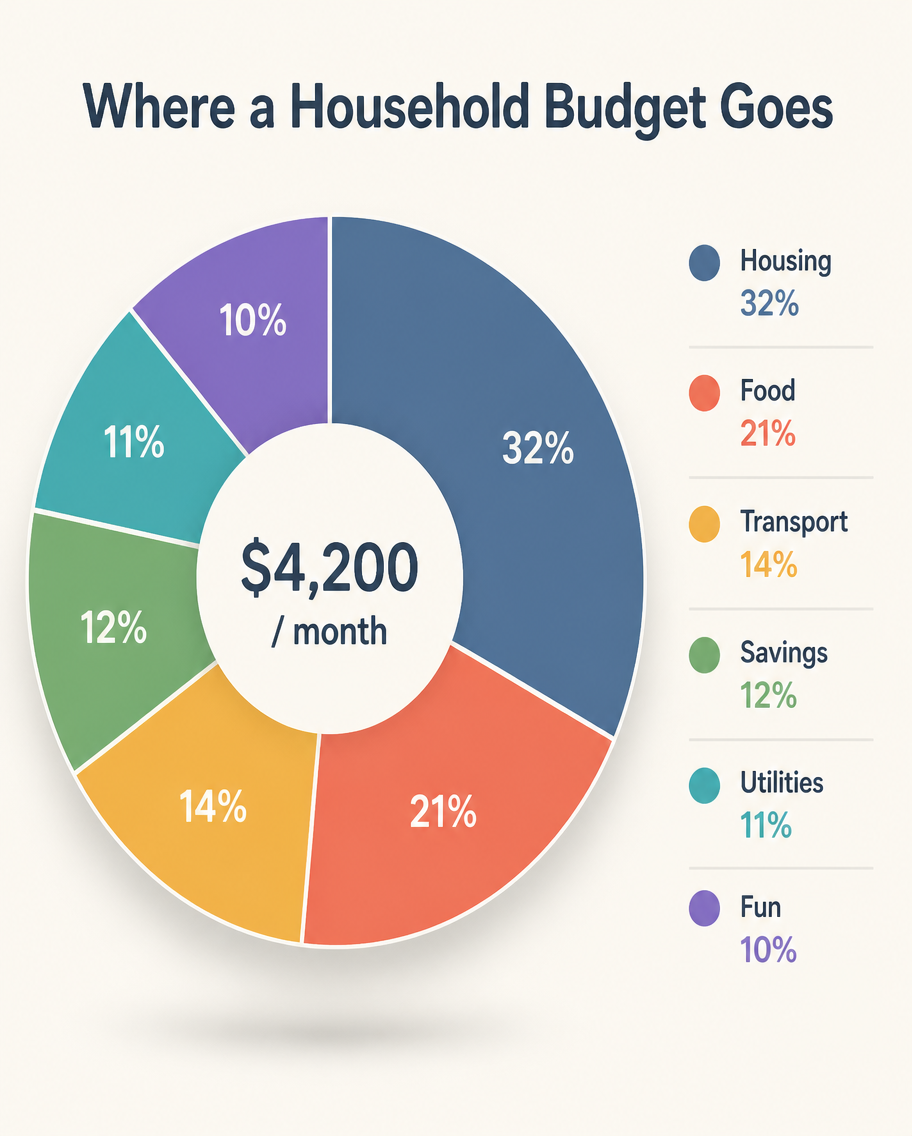
A minimalist infographic, 4:5, titled 'Where a Household Budget Goes'. A large centered donut chart splits monthly spending into six segments: Housing 32% (slate blue), Food 21% (coral), Transport 14% (amber), Savings 12% (green), Utilities 11% (teal), Fun 10% (violet). The donut's hollow center shows total '$4,200 / month'. A neat legend with color dots and labels sits to the right. Soft off-white background, thin dividing lines, rounded sans-serif type, subtle drop shadow under the donut, tidy modern layout.Come usare
- Copia tutto il prompt originale, inclusi i parametri.
- Adatta soggetto, testo e composizione alle tue esigenze.
- Usa uno strumento esterno compatibile; verifica accesso e risultato.
Prima di iniziare
- Controlla se serve un’immagine di riferimento. La compatibilità non prova il modello usato per l’esempio.
- Verifica nomi, numeri e testi; i risultati cambiano con le versioni del modello.