Design illustration · Website Traffic Analytics — API Models · CC BY 4.0

Design illustration · Website Traffic Analytics — API Models · CC BY 4.0

原始文档

GPT Image 2 · en

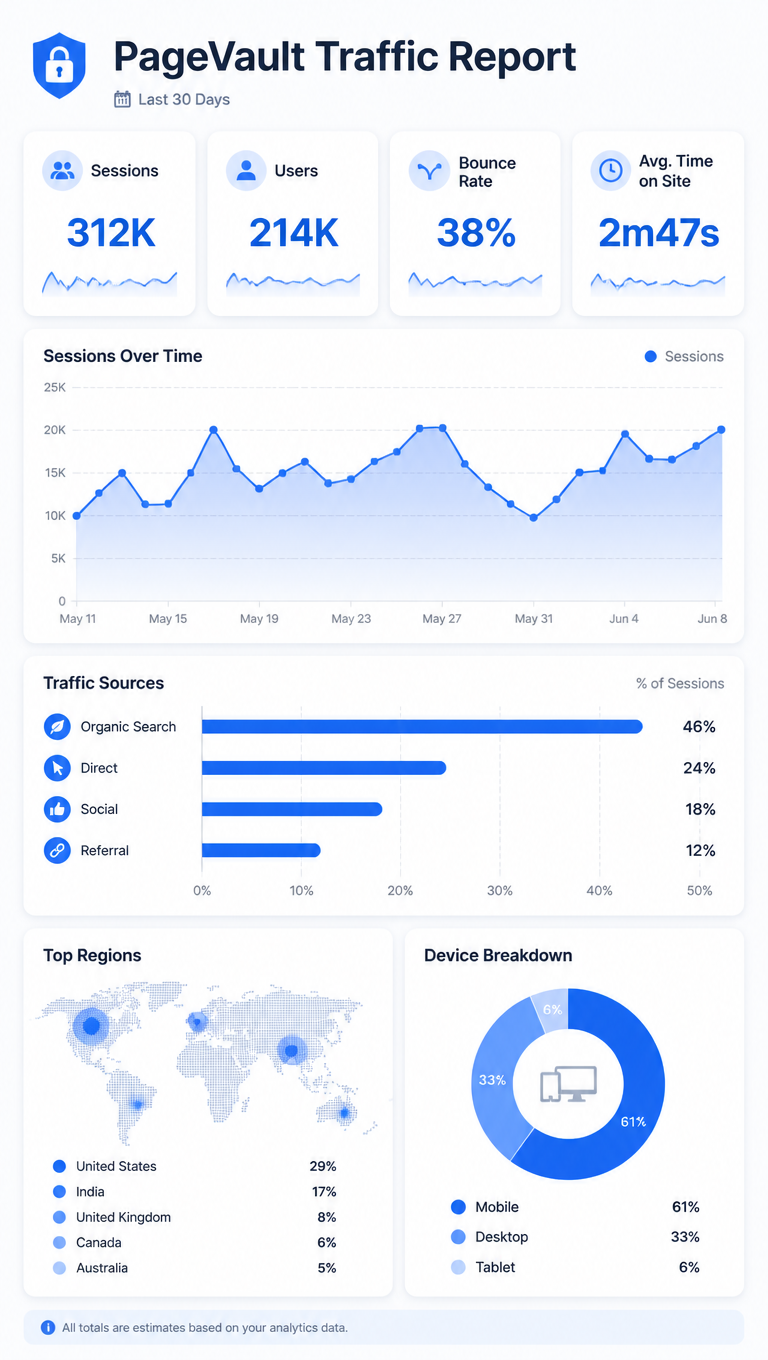
A dashboard infographic, 9:16, titled 'PageVault Traffic Report'. A vertical analytics slide: top tiles show Sessions 312K, Users 214K, Bounce 38%, Avg Time 2m47s. An area chart plots daily sessions over 30 days, a horizontal bar ranks traffic sources (Organic 46%, Direct 24%, Social 18%, Referral 12%), and a small world-map dot cluster highlights top regions. A device-split mini donut (Mobile 61%, Desktop 33%, Tablet 6%). Cool blue-and-white palette, rounded card widgets, faint grid, clean modern web-analytics dashboard aesthetic.

使用方法

  1. 复制完整原始提示词,并保留其中的参数。
  2. 按需求替换主体、文字和构图要求。
  3. 在兼容的外部工具中使用,核对当前使用条件并检查结果。

开始前需了解

  • 先确认是否需要参考图。标注兼容模型,不代表该示例由这个模型生成。
  • 核对名称、数字与画面文字;不同模型版本的结果可能不同。

相似案例

Japanese Mystery Website Mockup
GPT Image 2en

Goal: Create a polished website mockup for a Japanese mystery game or story archive titled {argument name="site title" default="月蝕綺譚"}, shown as a responsive design preview with one desktop browser window on the left and one smartphone screen on the right. Canvas: Wide 16:9 pres

Analytics Storytelling Dashboard Views — Support One
GPT Image 2en

Scene: Create a square standalone support image for Analytics Storytelling Dashboard Views. Build a support-surface study with a clear focal hierarchy and a finished professional surface. Use a polished modular board or campaign surface with clean spacing, premium game-UI finish,

Japanese Builder Website Hero Mockup
GPT Image 2zh

Presenting a beautiful presentation style mockup of a Japanese residential construction company website above the fold design concept on a dark charcoal gray background. In the upper right corner, place a large white rounded bubble box with 4 lines of concise sans-serif Japanese