原始文档
GPT Image 2 · en
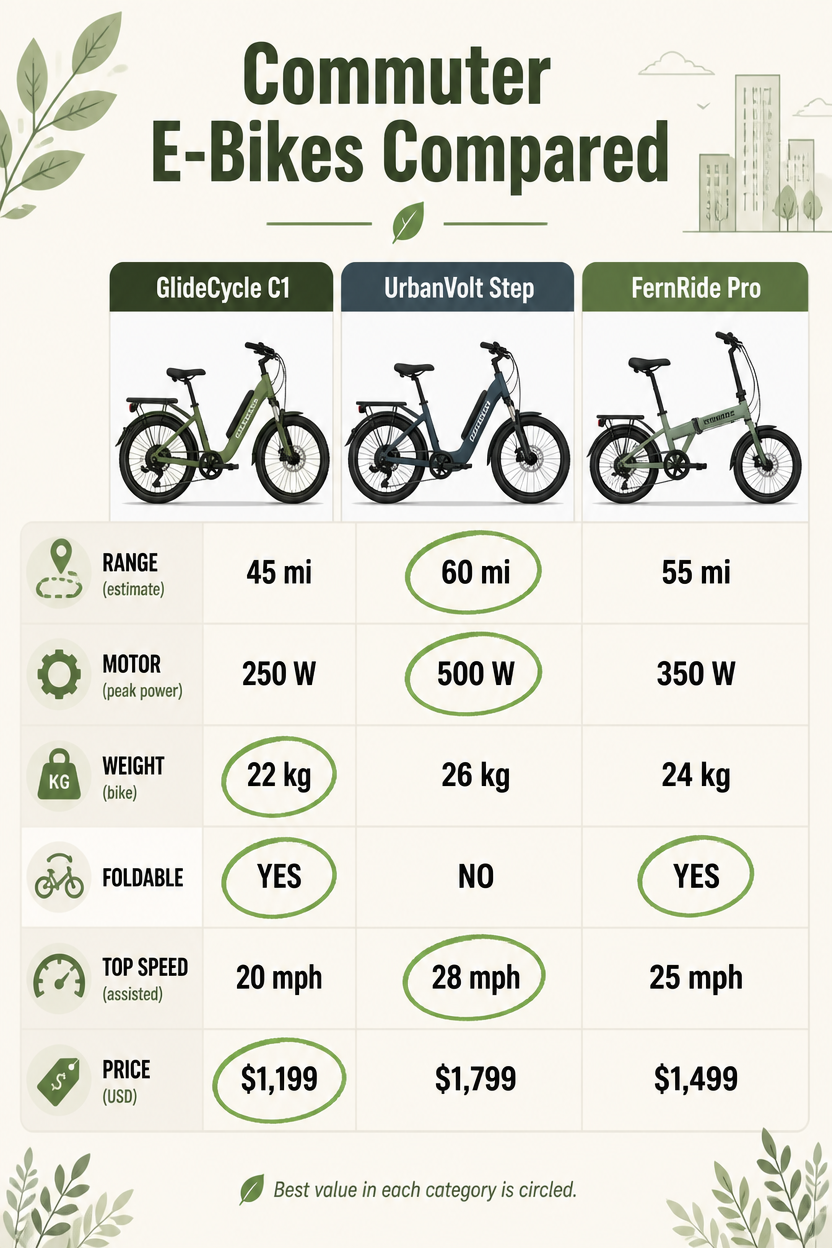
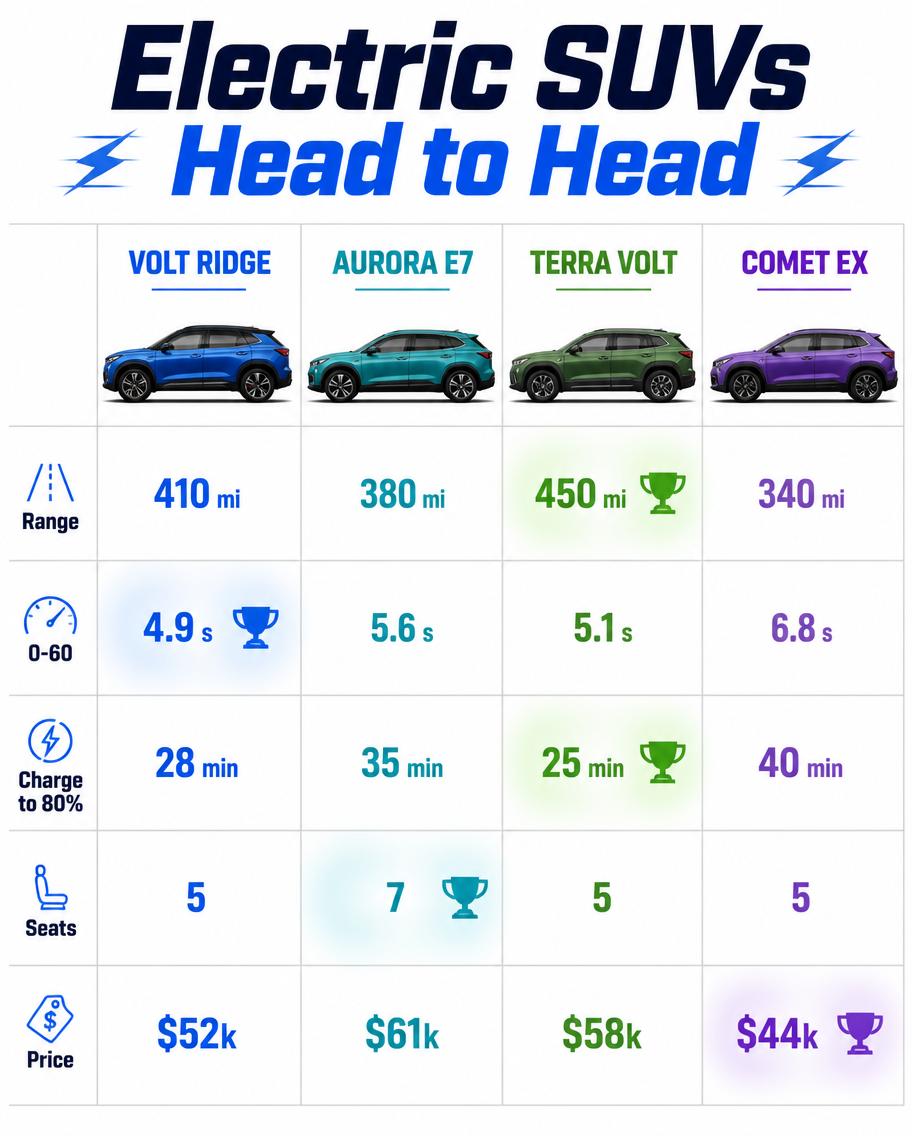
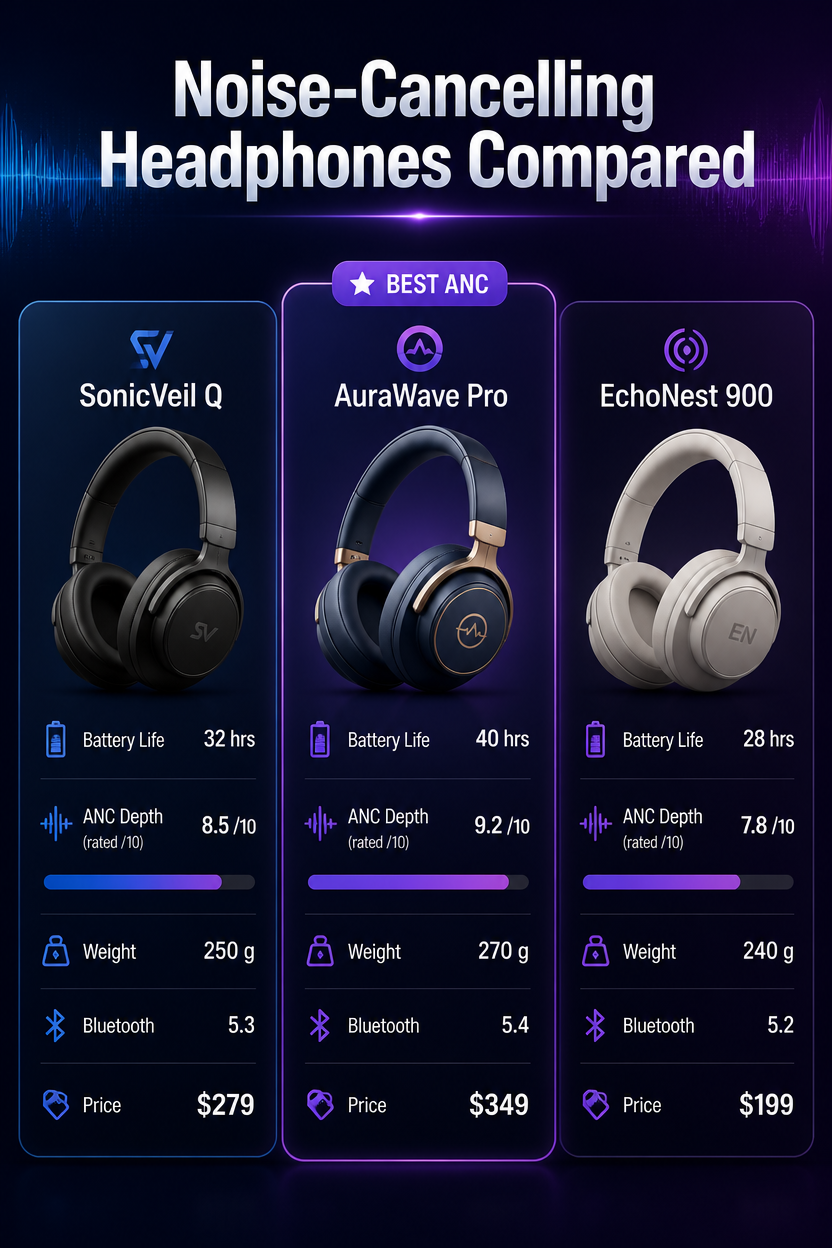
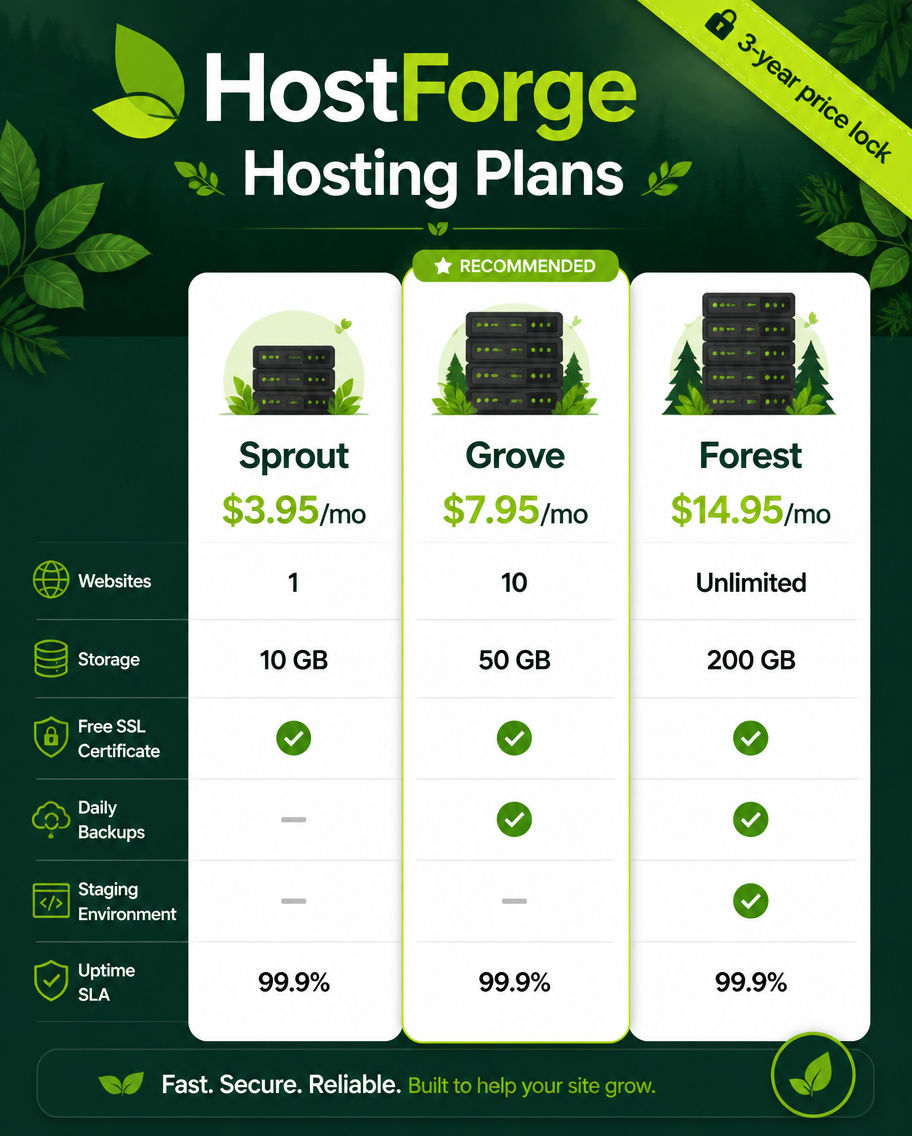
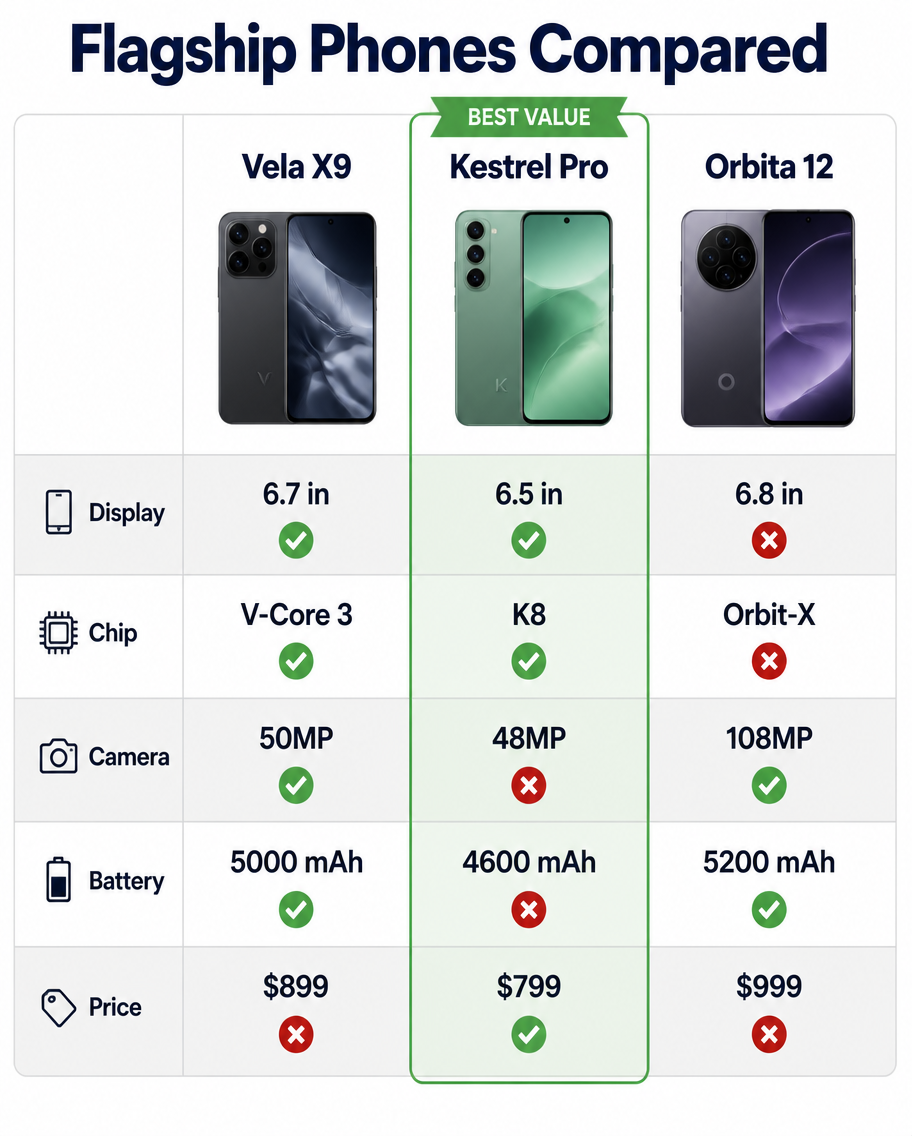
A product comparison infographic, 4:5, titled 'Flagship Phones Compared'. A three-column table for invented brands: Vela X9, Kestrel Pro, Orbita 12. Rows list Display (6.7in vs 6.5in vs 6.8in), Chip (V-Core 3 vs K8 vs Orbit-X), Camera (50MP vs 48MP vs 108MP), Battery (5000 vs 4600 vs 5200 mAh), Price ($899 vs $799 vs $999). The middle column is highlighted as 'Best Value' with a green ribbon. Alternating light-grey row bands, small check and cross icons, product silhouettes at column tops. Clean white, bold header row, crisp sans-serif.使用方法
- 复制完整原始提示词,并保留其中的参数。
- 按需求替换主体、文字和构图要求。
- 在兼容的外部工具中使用,核对当前使用条件并检查结果。
开始前需了解
- 先确认是否需要参考图。标注兼容模型,不代表该示例由这个模型生成。
- 核对名称、数字与画面文字;不同模型版本的结果可能不同。