Original document
GPT Image 2 · en
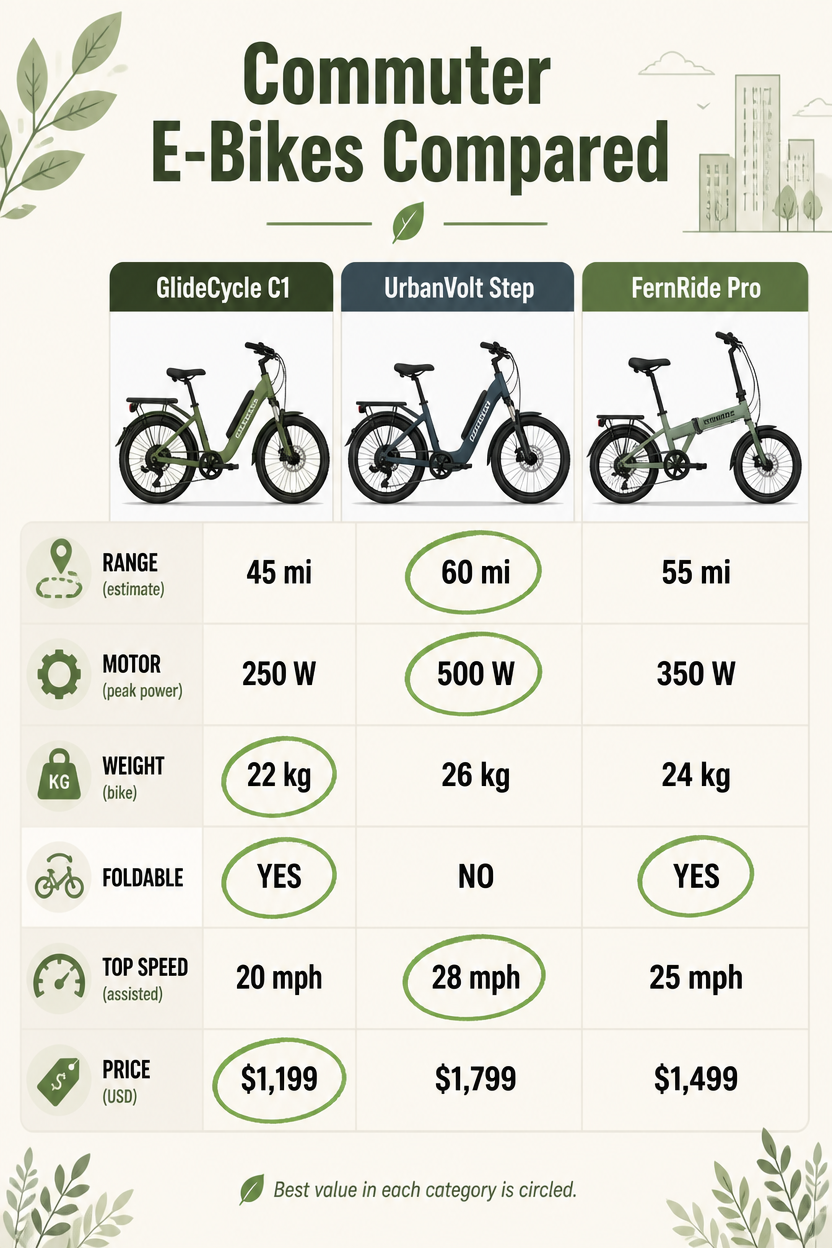
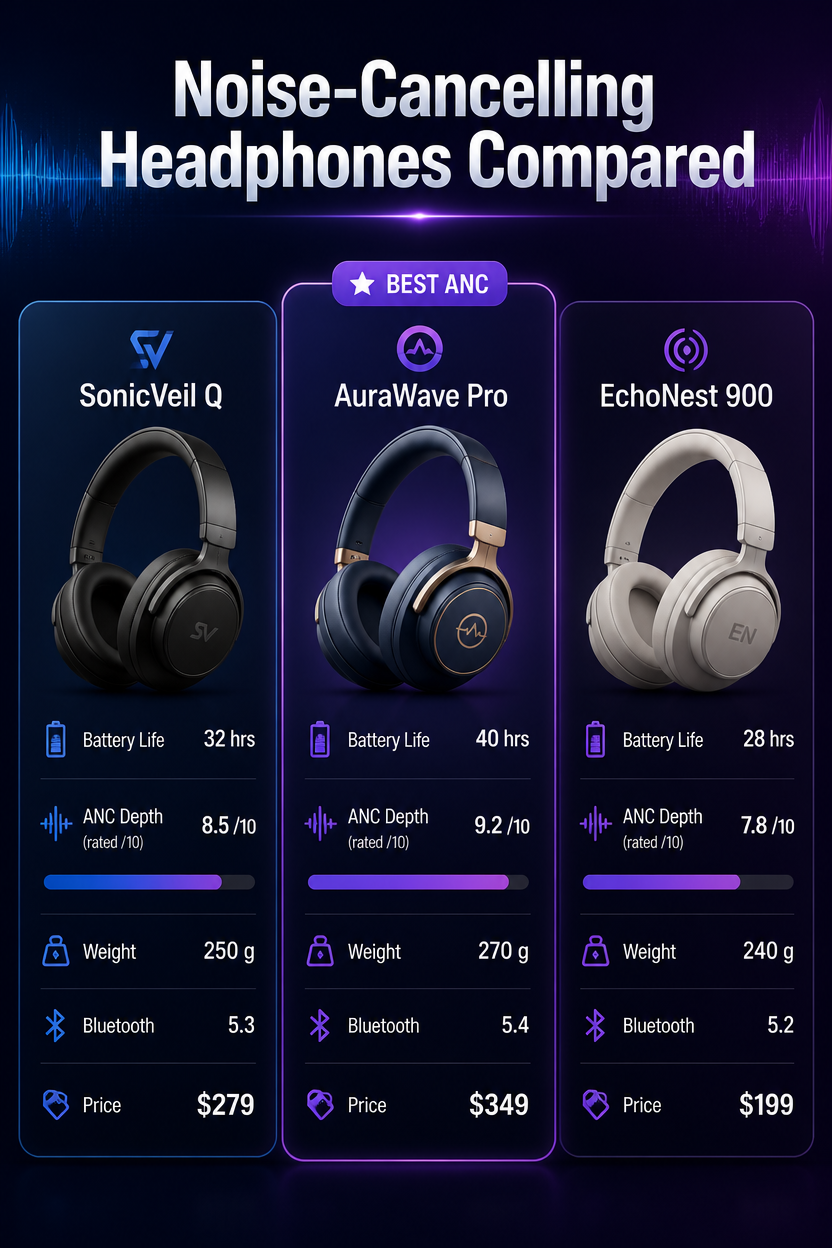
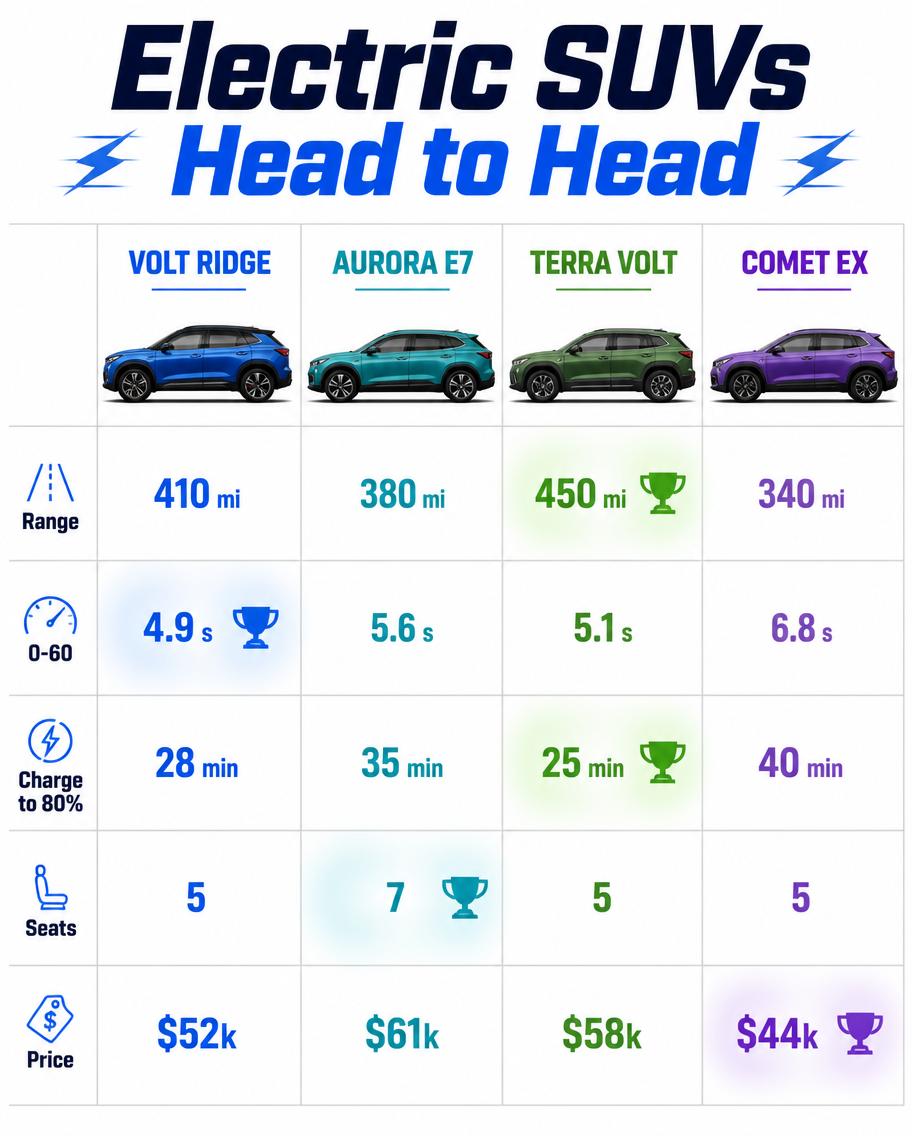
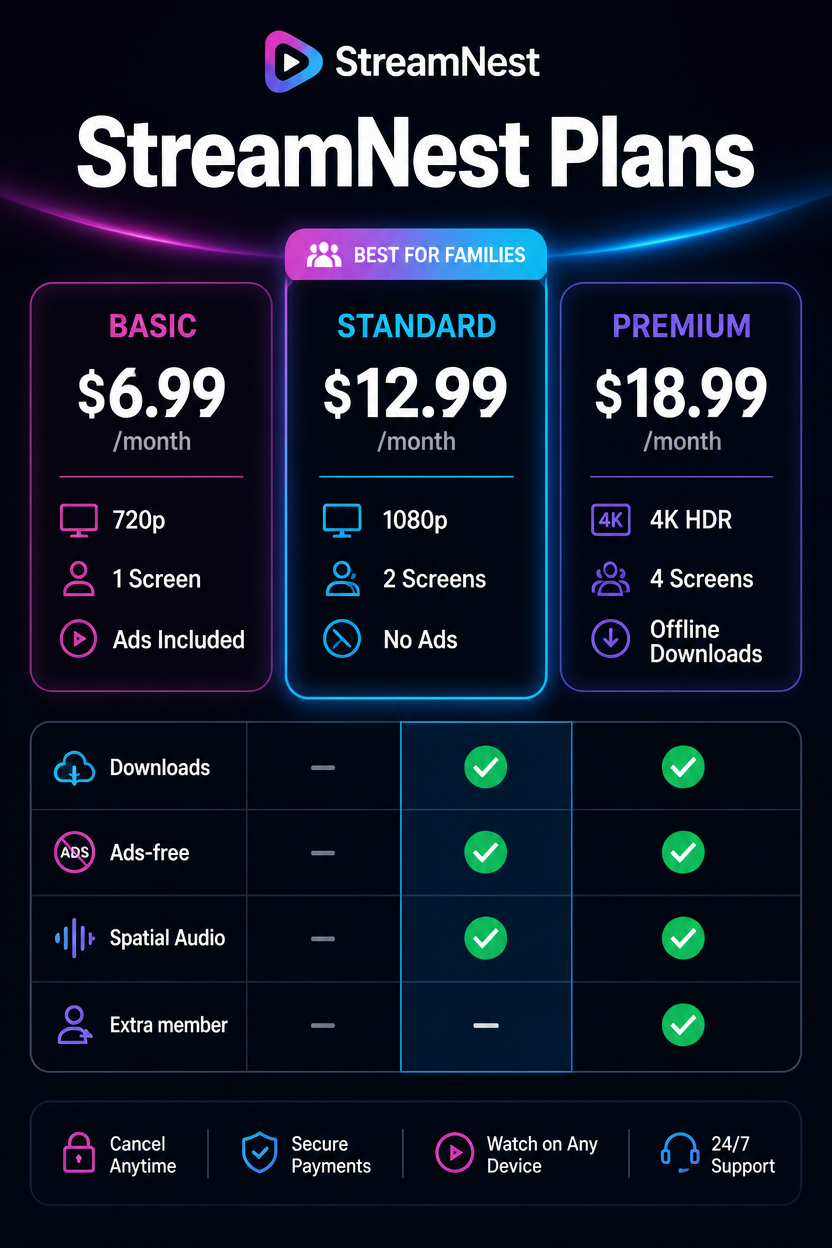
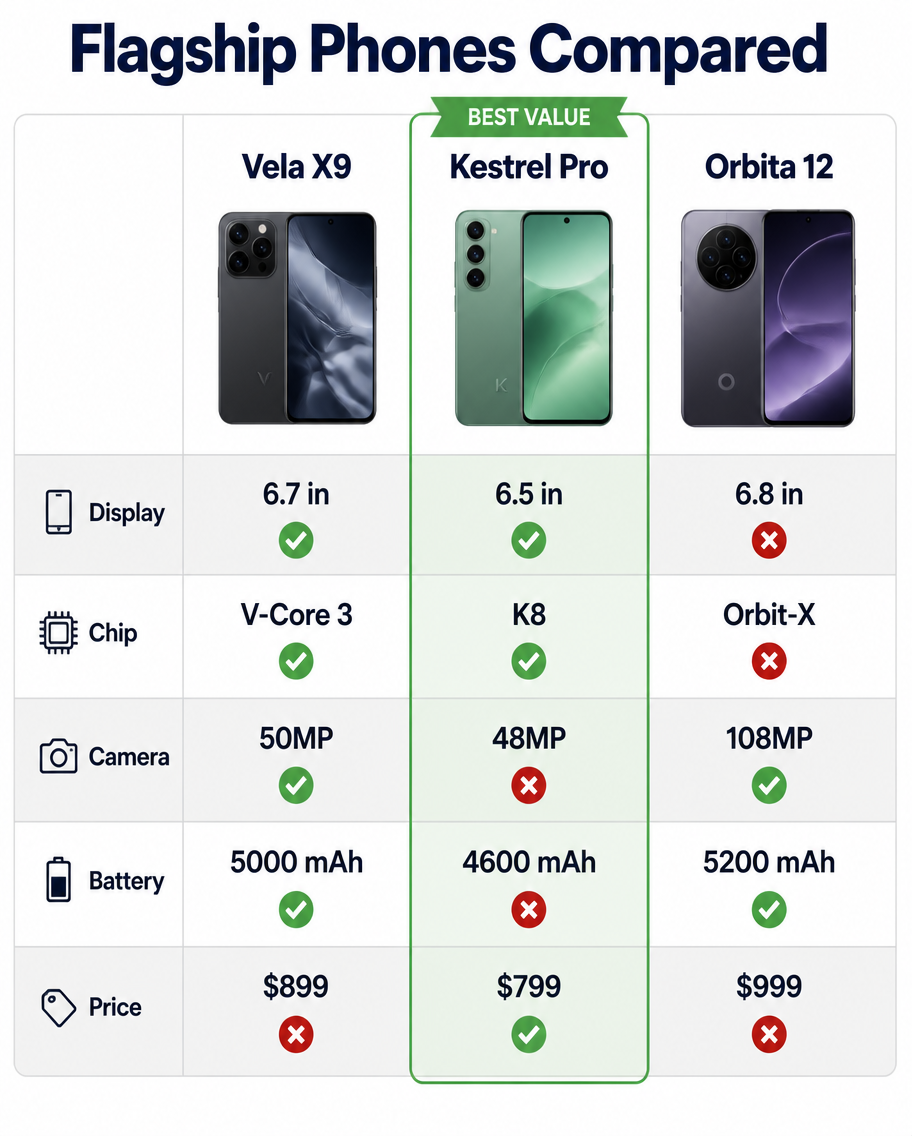
A product comparison infographic, 4:5, titled 'Flagship Phones Compared'. A three-column table for invented brands: Vela X9, Kestrel Pro, Orbita 12. Rows list Display (6.7in vs 6.5in vs 6.8in), Chip (V-Core 3 vs K8 vs Orbit-X), Camera (50MP vs 48MP vs 108MP), Battery (5000 vs 4600 vs 5200 mAh), Price ($899 vs $799 vs $999). The middle column is highlighted as 'Best Value' with a green ribbon. Alternating light-grey row bands, small check and cross icons, product silhouettes at column tops. Clean white, bold header row, crisp sans-serif.How to use
- Copy the complete original prompt, including any parameters.
- Replace the subject, text and composition with your own requirements.
- Use a compatible external tool; check its current access conditions and review the result.
Before you start
- Check whether a reference image is required. A compatible model label does not mean this example was generated with that model.
- Keep names, figures and visible text accurate; results can vary between model versions.