原始文档
GPT Image 2 · en
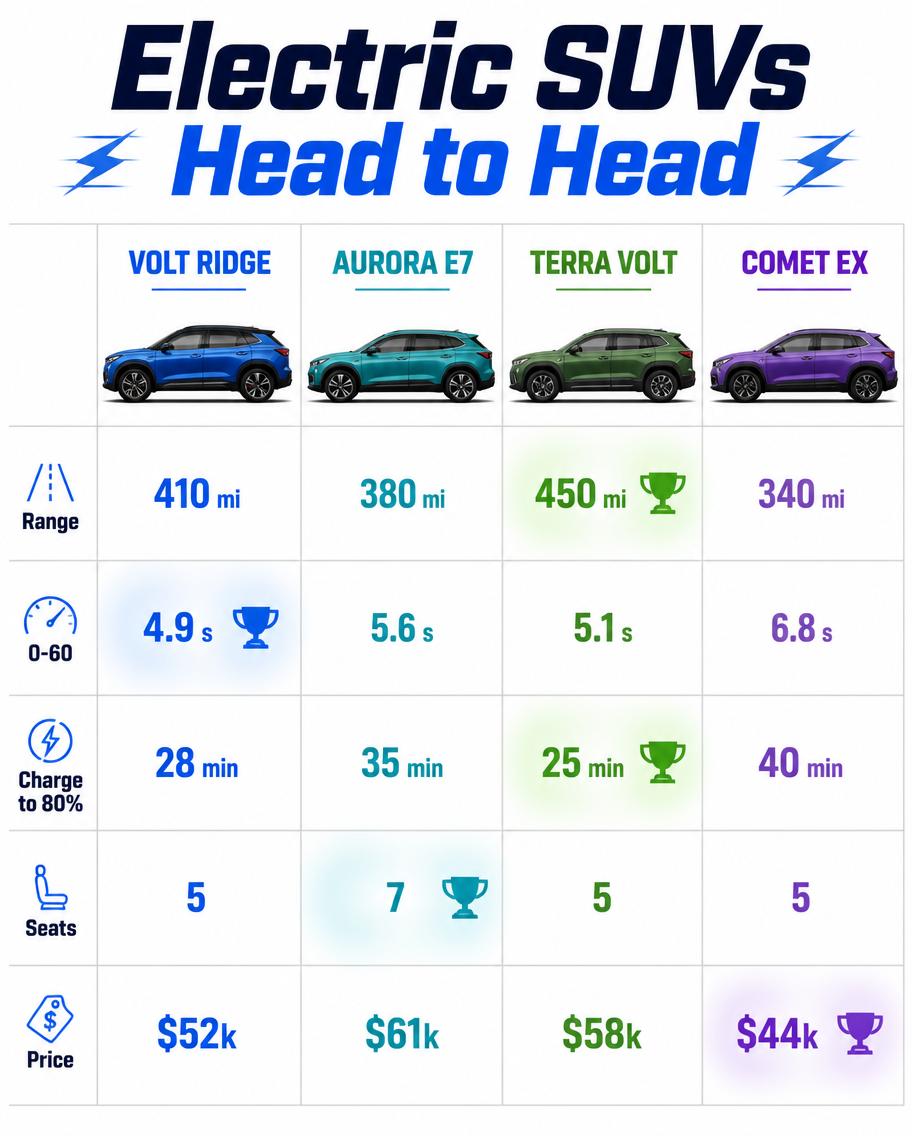
A vehicle comparison infographic, 4:5, titled 'Electric SUVs Head to Head'. A four-column table for invented EVs: Volt Ridge, Aurora E7, Terra Volt, Comet EX. Side-profile car illustrations top each column in matching accent colors. Rows: Range (410 vs 380 vs 450 vs 340 mi), 0-60 (4.9 vs 5.6 vs 5.1 vs 6.8 s), Charge to 80% (28 vs 35 vs 25 vs 40 min), Seats (5 vs 7 vs 5 vs 5), Price ($52k vs $61k vs $58k vs $44k). Best-in-row values glow with a small trophy icon. Clean white background, electric-blue and green palette, bold headers, sharp modern typography.使用方法
- 复制完整原始提示词,并保留其中的参数。
- 按需求替换主体、文字和构图要求。
- 在兼容的外部工具中使用,核对当前使用条件并检查结果。
开始前需了解
- 先确认是否需要参考图。标注兼容模型,不代表该示例由这个模型生成。
- 核对名称、数字与画面文字;不同模型版本的结果可能不同。