Design illustration · How To Tie A Tie — API Models · CC BY 4.0

Design illustration · How To Tie A Tie — API Models · CC BY 4.0

Original document

GPT Image 2 · en

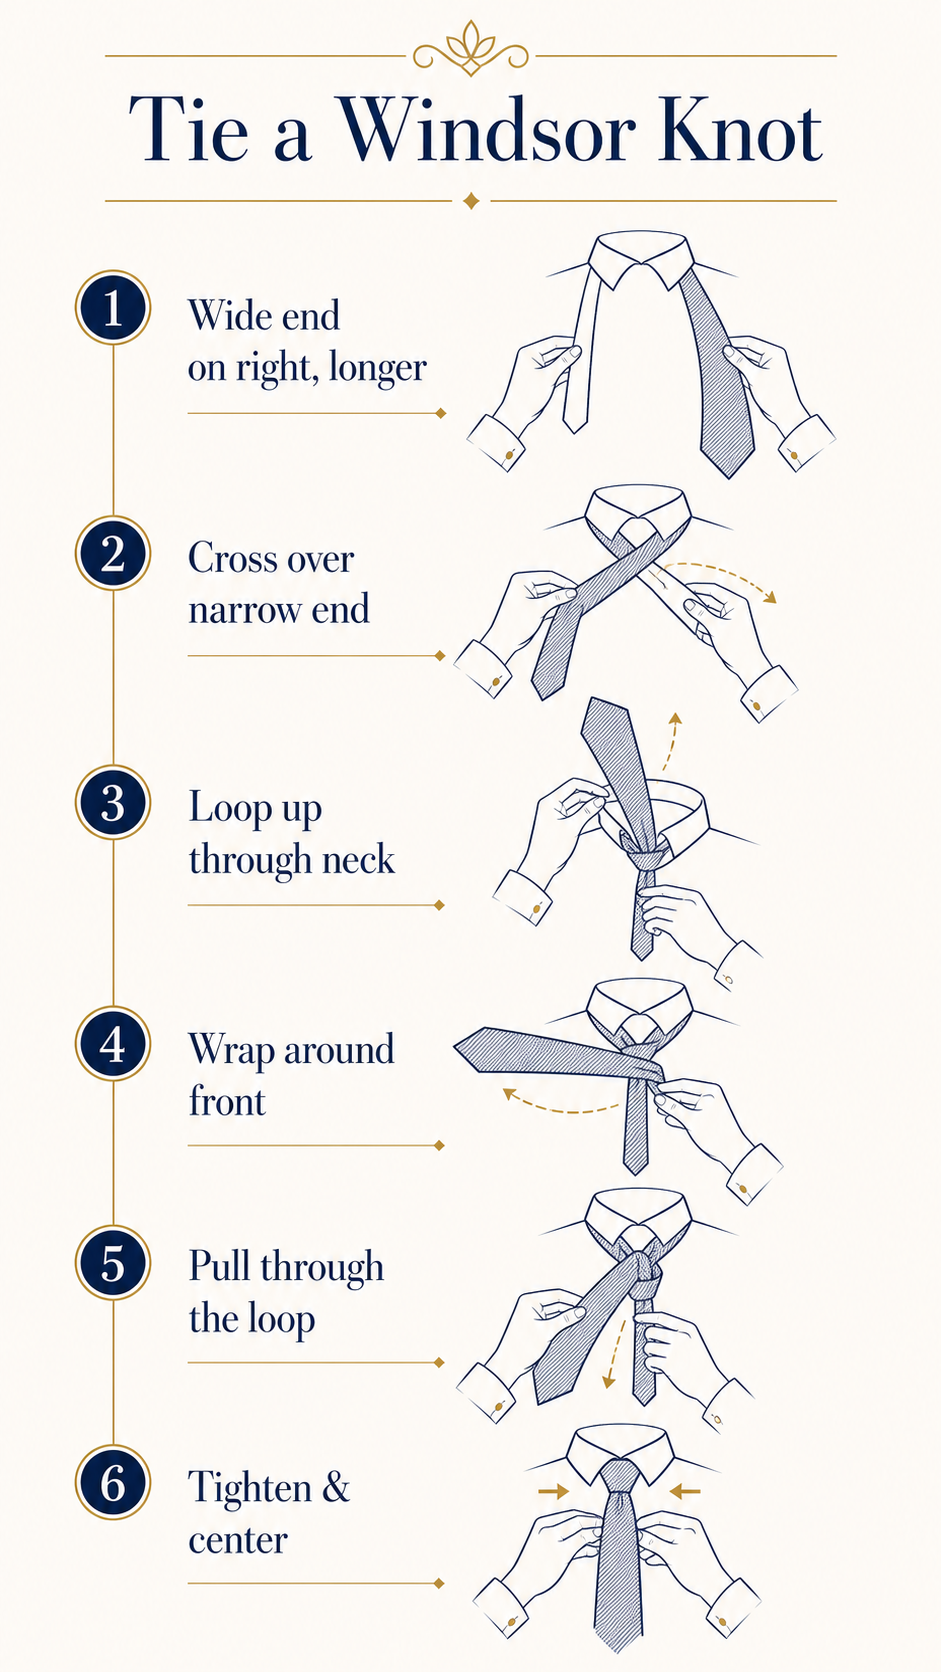
A style how-to infographic, 9:16, titled 'Tie a Windsor Knot'. Six vertical steps, each showing a clean line diagram of hands and tie with dashed motion arrows: 1 Wide end on right, longer, 2 Cross over narrow end, 3 Loop up through neck, 4 Wrap around front, 5 Pull through the loop, 6 Tighten & center. Small numbered circles connect the steps down the page. Sophisticated navy-and-gold palette, off-white background, minimalist elegant icons, refined thin serif headings, tidy gentlemen's-guide aesthetic.

How to use

  1. Copy the complete original prompt, including any parameters.
  2. Replace the subject, text and composition with your own requirements.
  3. Use a compatible external tool; check its current access conditions and review the result.

Before you start

  • Check whether a reference image is required. A compatible model label does not mean this example was generated with that model.
  • Keep names, figures and visible text accurate; results can vary between model versions.
More like this

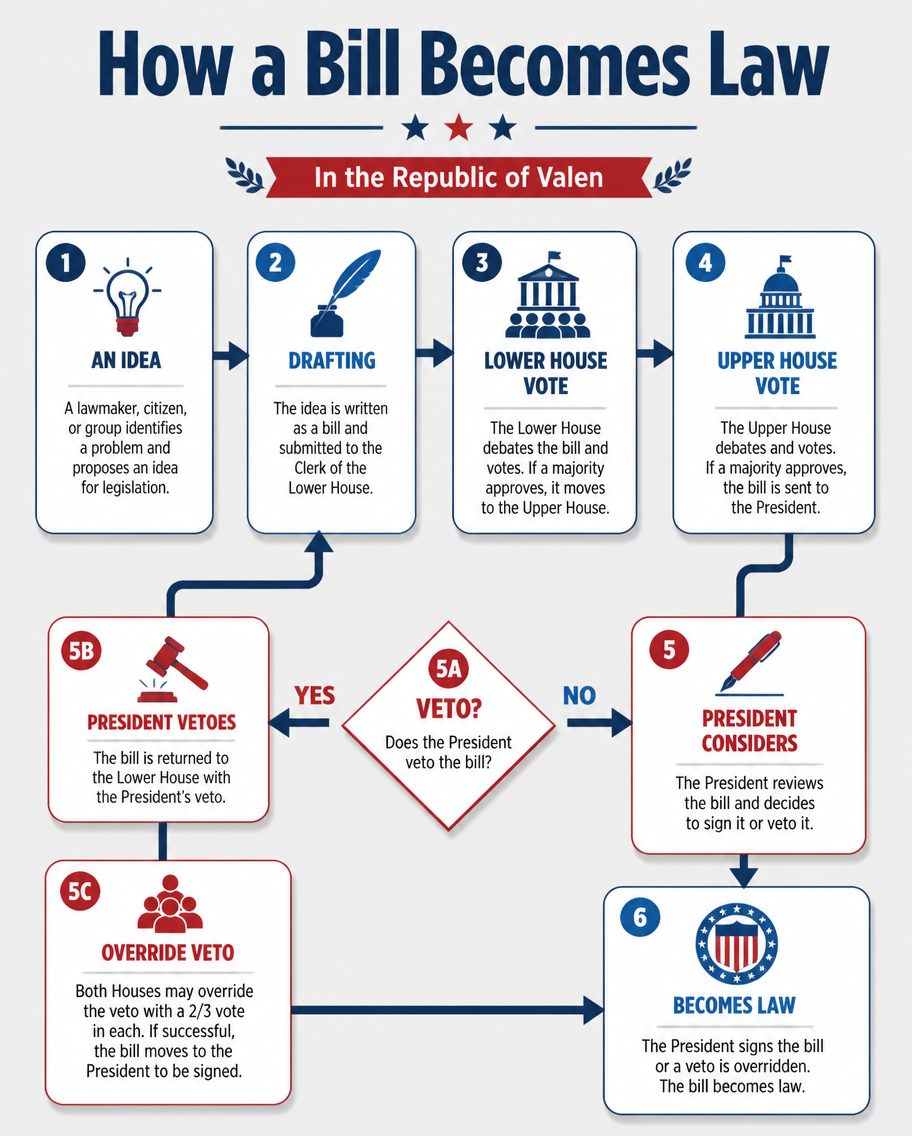
How a Bill Becomes Law
GPT Image 2en

A civics flow-diagram infographic explaining how a bill becomes law in the fictional Republic of Valen. Boxes connected by arrows trace 'idea', 'drafting', 'lower house vote', 'upper house vote', 'president signs', 'becomes law', with a branching 'veto' loop back. Numbered steps

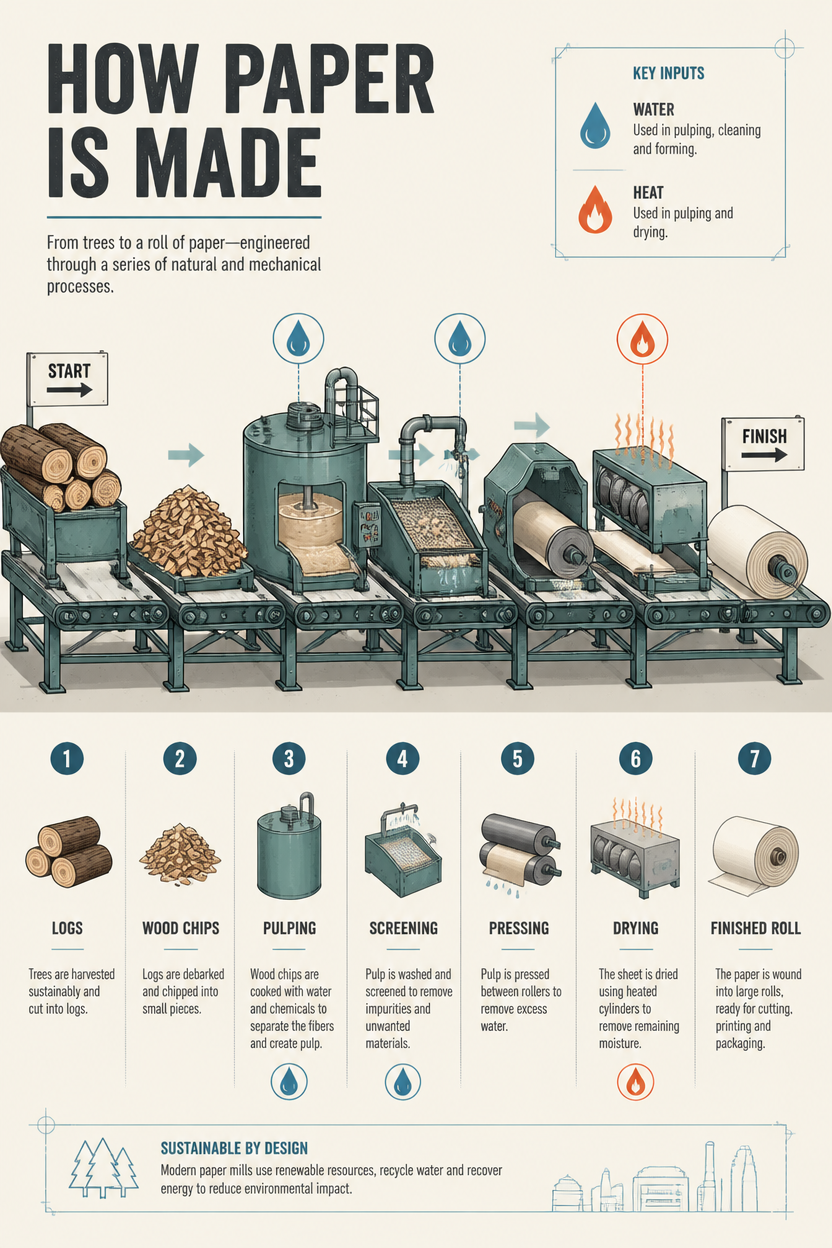
How Paper Is Made
GPT Image 2en

A manufacturing process infographic of how paper is made, shown as a factory line flowing left to right. Illustrated stages - logs, wood chips, a pulping vat, screening, pressing rollers, drying, and a finished paper roll - connect via a conveyor with numbered steps and short cap

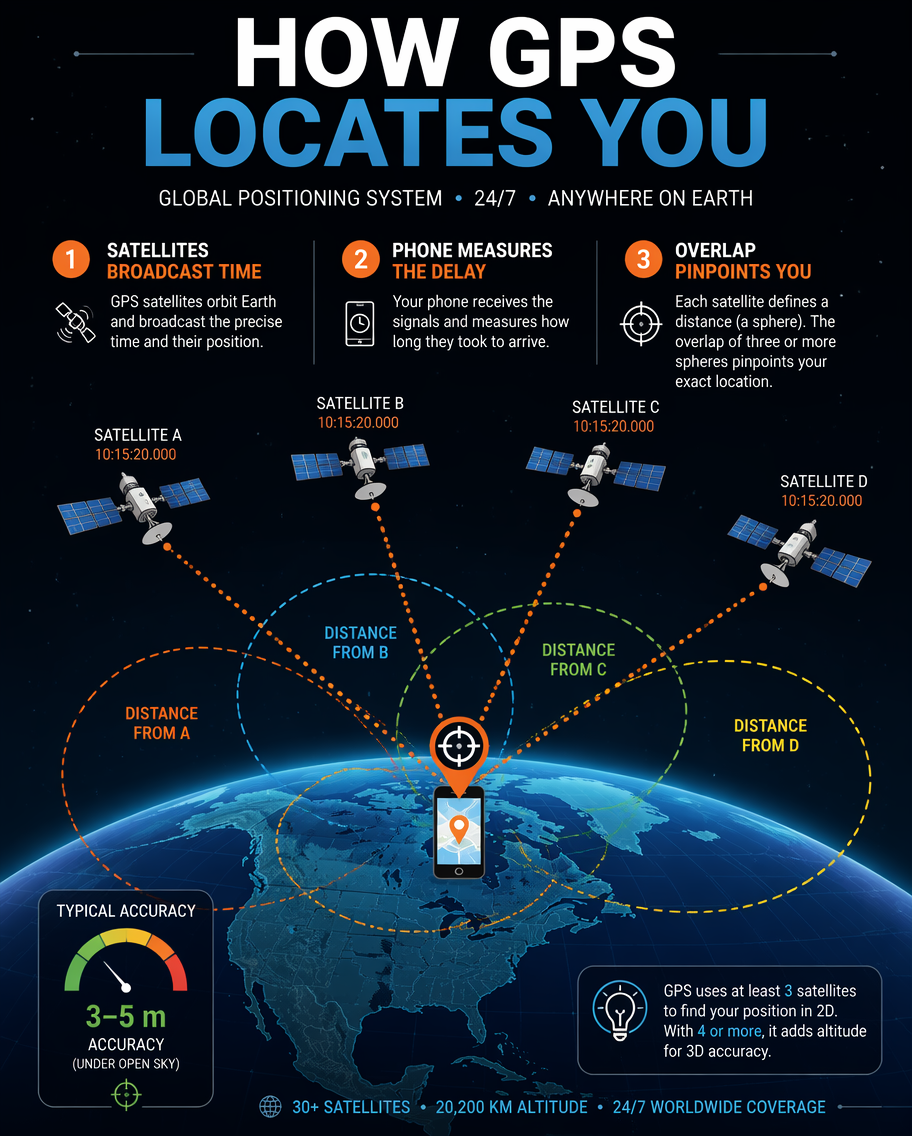
How GPS Locates You
GPT Image 2en

A technology infographic explaining how GPS finds your location, drawn as a scene with three or four satellites beaming signals down to a phone on a stylized globe. Dotted signal lines and expanding range circles illustrate trilateration; numbered captions explain 'satellites bro

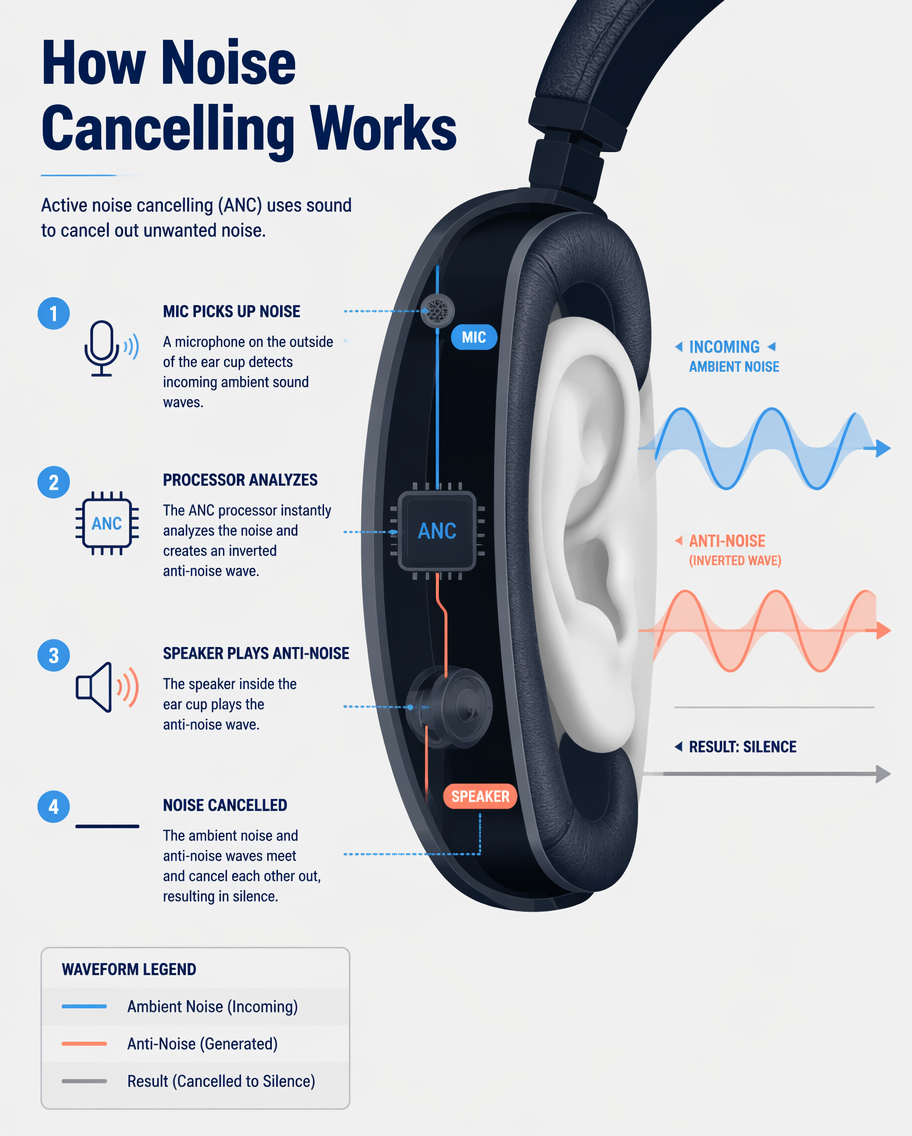
How Noise Cancelling Works
GPT Image 2en

A technology infographic explaining active noise cancelling in headphones, drawn as a cross-section of an ear cup around an ear. Incoming ambient sound waves meet an inverted 'anti-noise' wave generated by the headphone, and the two flatten to silence - shown with layered blue an

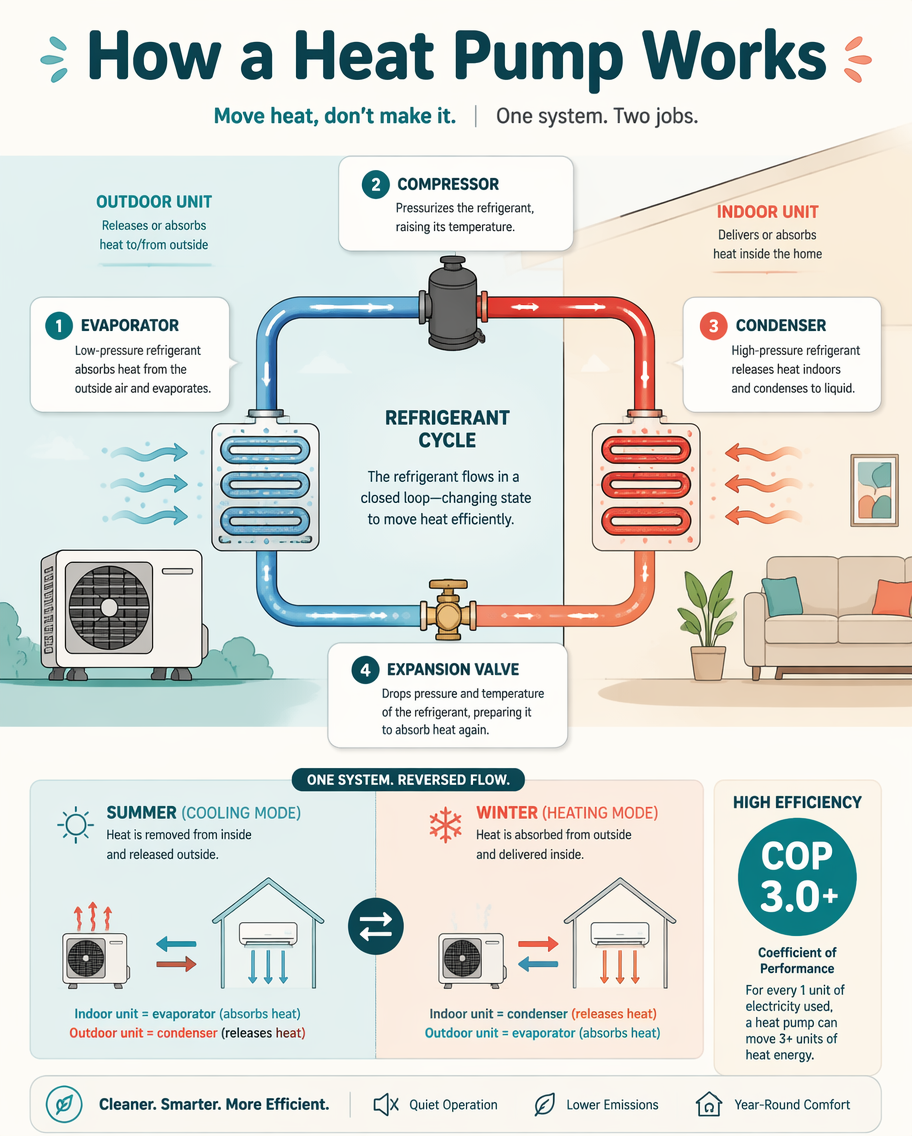
How a Heat Pump Works
GPT Image 2en

A home-tech infographic explaining how a heat pump heats and cools a house, drawn as a looping refrigerant cycle between an outdoor and indoor unit. Labeled stages - evaporator, compressor, condenser, expansion valve - carry colored arrows (blue for cold, red for warm) around the