Original document
GPT Image 2 · en
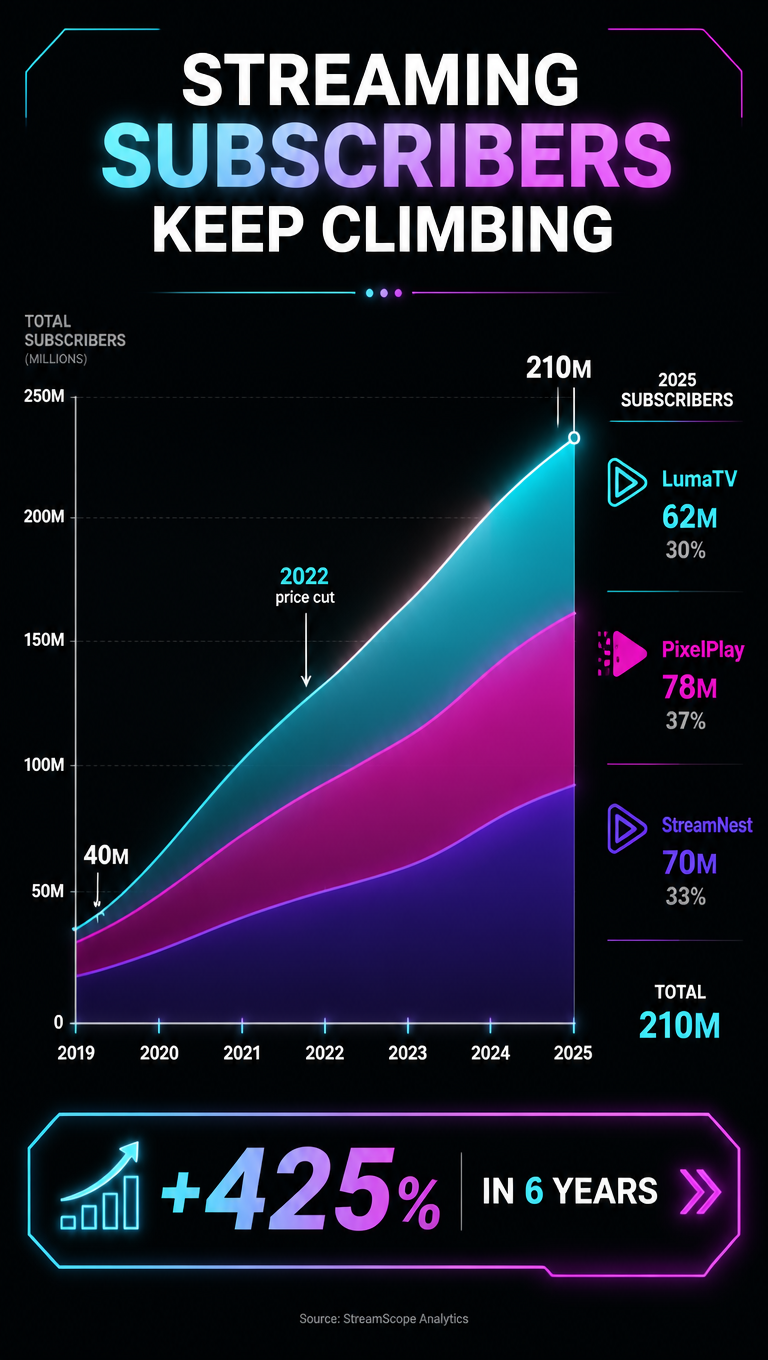
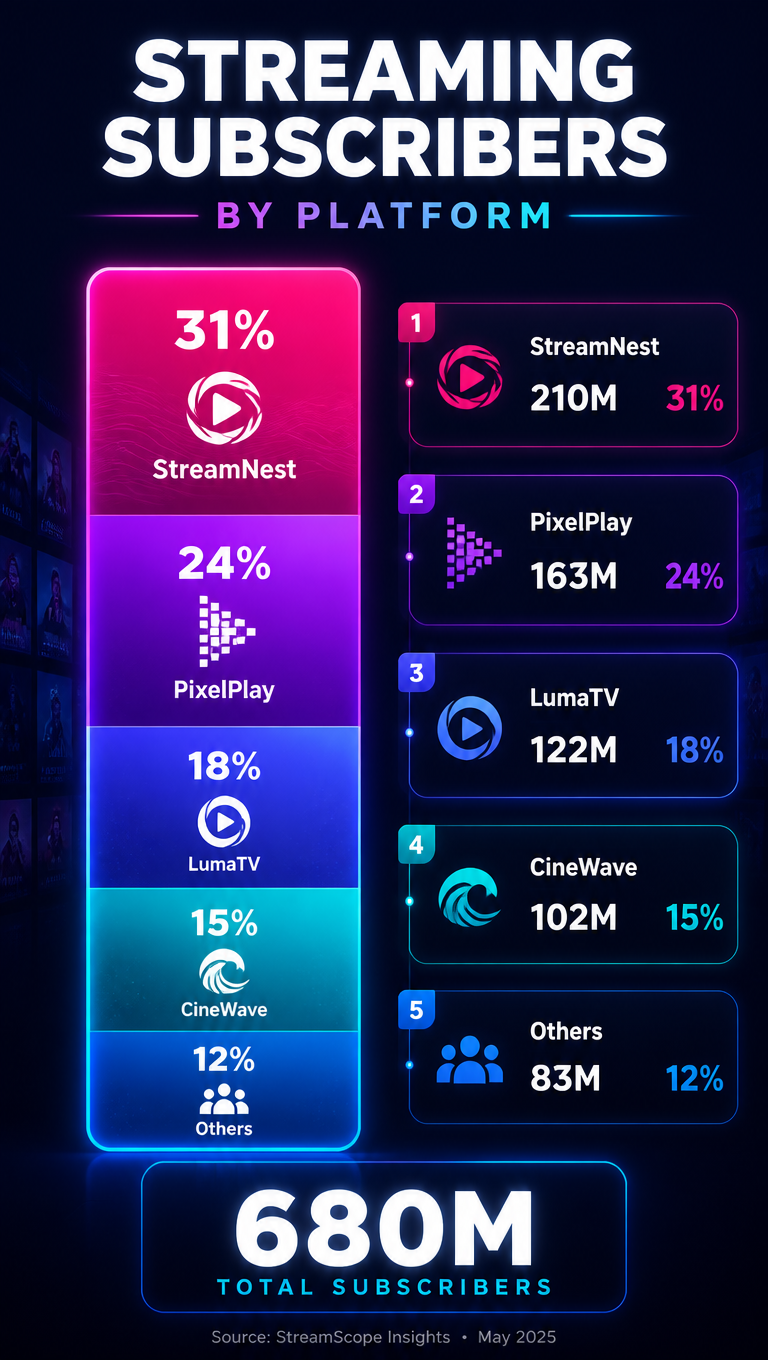
A media market-share infographic, 9:16, titled 'Streaming Subscribers by Platform'. A vertical stacked-column layout where one tall bar splits into invented services: StreamNest 31%, PixelPlay 24%, LumaTV 18%, CineWave 15%, Others 12%, each segment labeled with a percentage and a tiny logo shape. Beside it, a ranked mini-card list repeats the numbers with subscriber counts (e.g., StreamNest 210M). A footer '680M total subscribers'. Deep midnight-blue background, magenta-cyan gradient segments, glowing edges, sleek streaming-brand data aesthetic, bold white type.How to use
- Copy the complete original prompt, including any parameters.
- Replace the subject, text and composition with your own requirements.
- Use a compatible external tool; check its current access conditions and review the result.
Before you start
- Check whether a reference image is required. A compatible model label does not mean this example was generated with that model.
- Keep names, figures and visible text accurate; results can vary between model versions.