Gaming Console Share

Gaming Console Share

Original document

GPT Image 2 · en

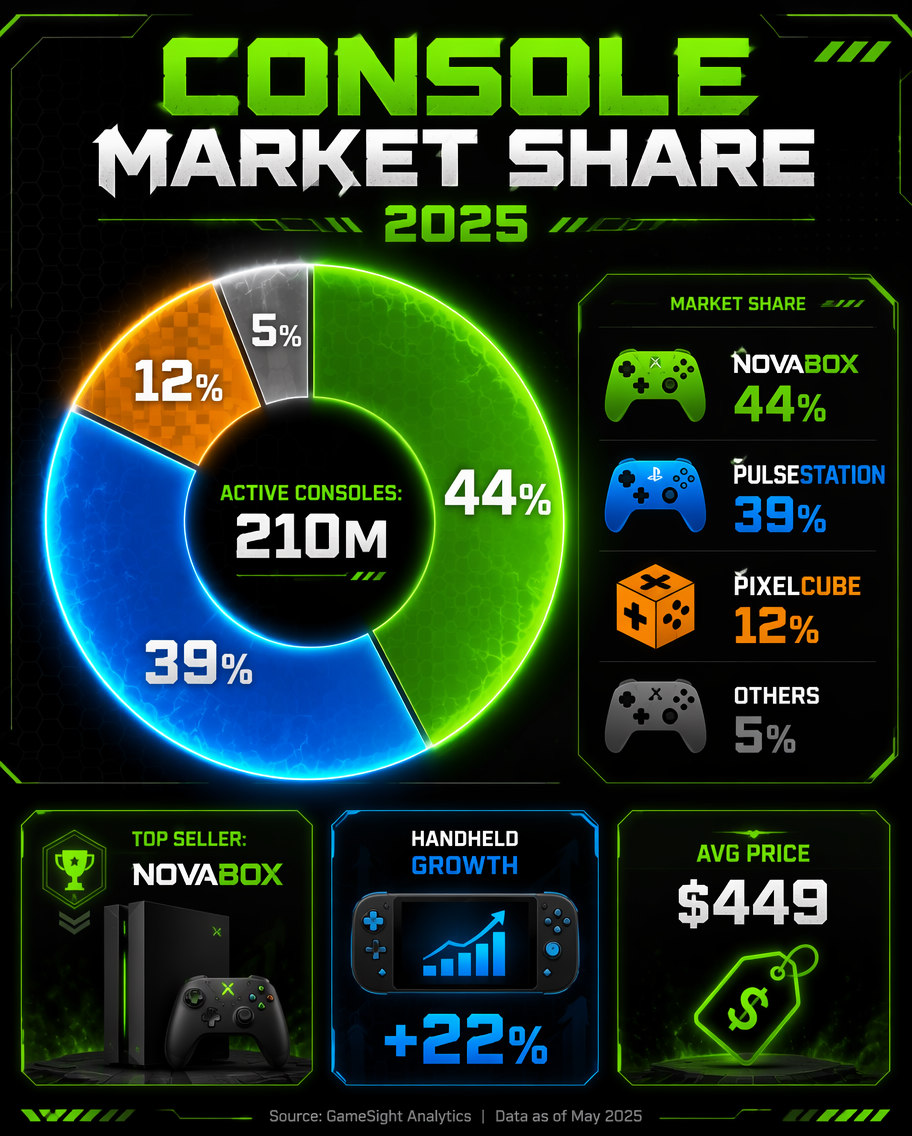
A gaming market-share infographic, 4:5, titled 'Console Market Share 2025'. A donut chart splits invented consoles: NovaBox 44% (green), PulseStation 39% (blue), PixelCube 12% (orange), Others 5% (grey). Center label 'Active consoles: 210M'. A legend with controller-shaped color chips and percentages, plus three mini stat tiles: 'Top seller: NovaBox', 'Handheld growth +22%', 'Avg price $449'. Dark gamer palette of black, neon-green, and electric-blue, glowing donut edges, angular futuristic accents, bold arcade-style headline, sleek gaming data aesthetic.

How to use

  1. Copy the complete original prompt, including any parameters.
  2. Replace the subject, text and composition with your own requirements.
  3. Use a compatible external tool; check its current access conditions and review the result.

Before you start

  • Check whether a reference image is required. A compatible model label does not mean this example was generated with that model.
  • Keep names, figures and visible text accurate; results can vary between model versions.
More like this

Mobile OS Market Share
GPT Image 2en

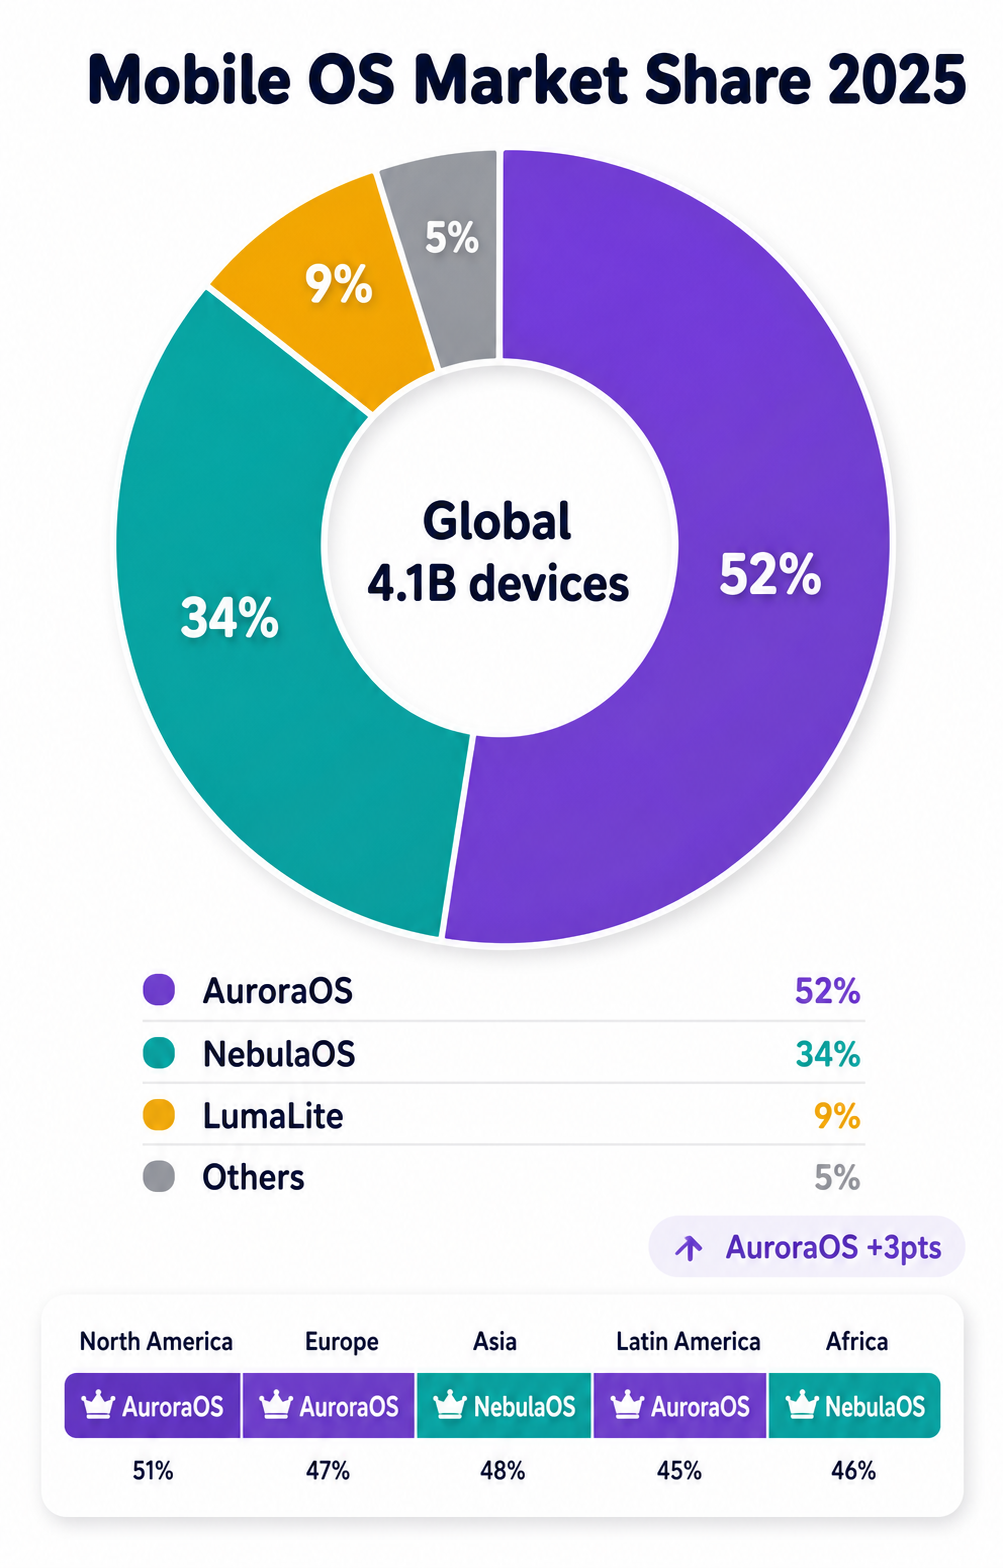
A market-share infographic, 4:5, titled 'Mobile OS Market Share 2025'. A large donut chart splits the market between invented systems: AuroraOS 52% (purple), NebulaOS 34% (teal), LumaLite 9% (amber), Others 5% (grey). The donut center reads 'Global 4.1B devices'. A legend with co

EV Brand Market Share
GPT Image 2en

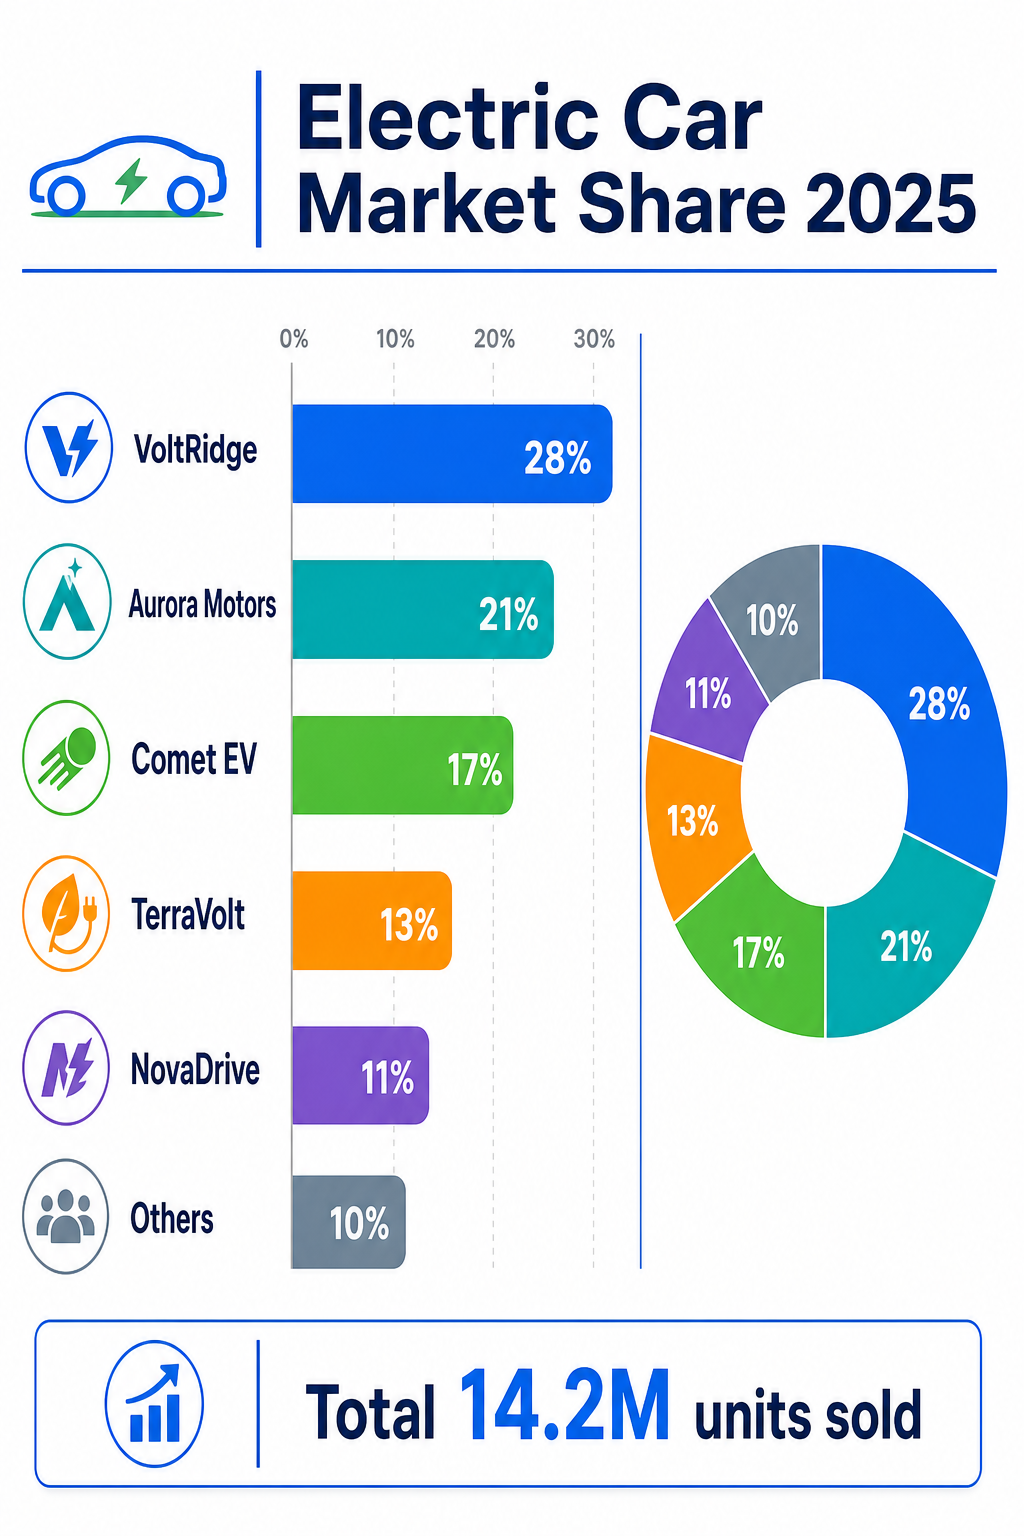
A market-share infographic, 2:3, titled 'Electric Car Market Share 2025'. A horizontal bar chart ranks invented EV makers: VoltRidge 28%, Aurora Motors 21%, Comet EV 17%, TerraVolt 13%, NovaDrive 11%, Others 10%, each bar in a distinct color with the percentage in bold. Small car

Ride-Hailing Market Share
GPT Image 2en

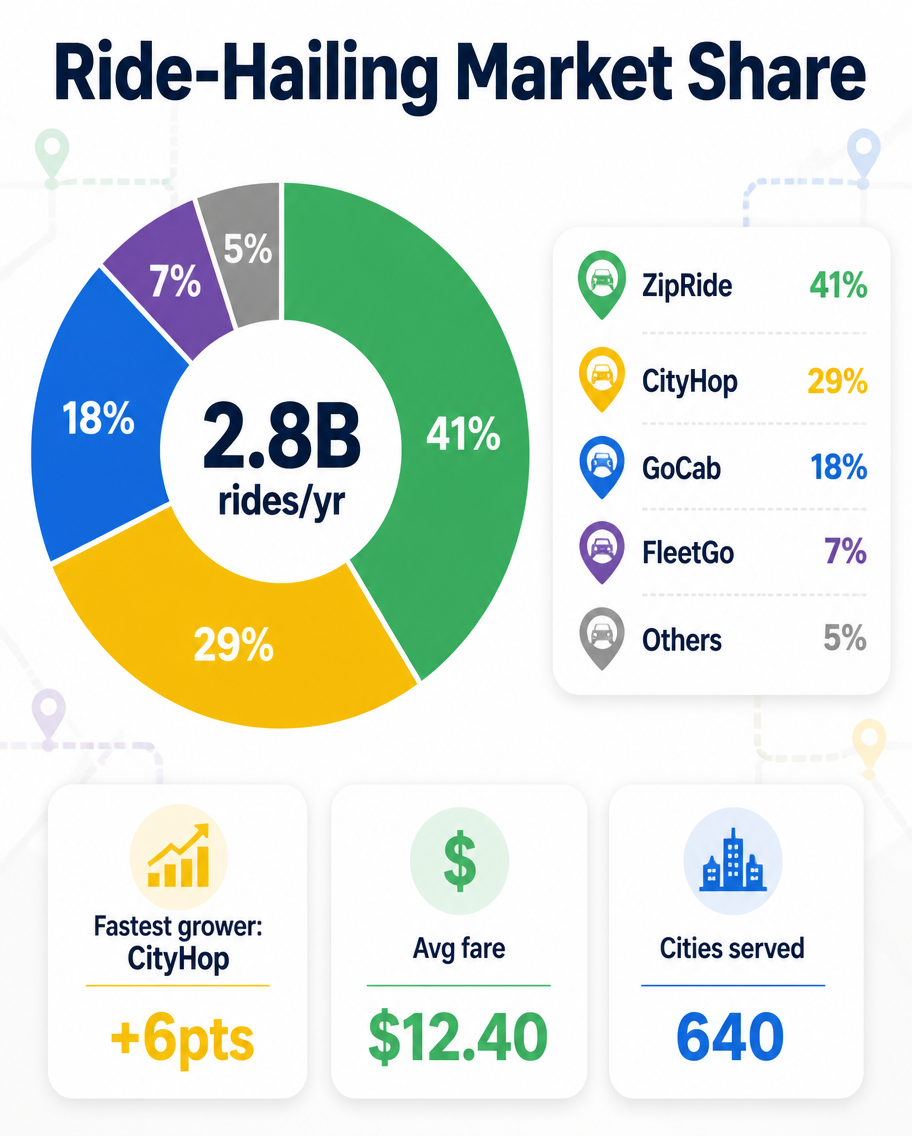
A mobility market-share infographic, 4:5, titled 'Ride-Hailing Market Share'. A donut chart divides invented apps: ZipRide 41% (green), CityHop 29% (yellow), GoCab 18% (blue), FleetGo 7% (purple), Others 5% (grey). Center reads '2.8B rides/yr'. A legend with car-pin color chips a

Streaming Platform Share
GPT Image 2en

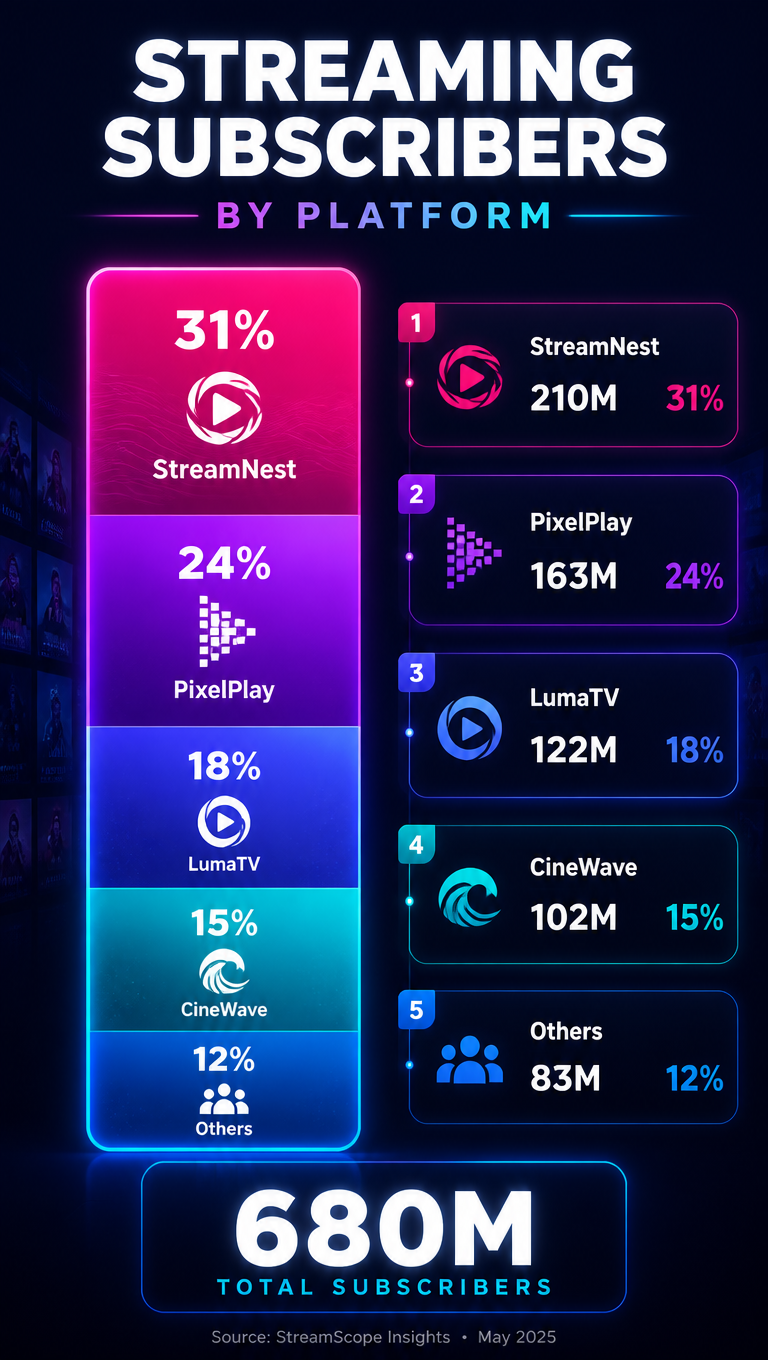
A media market-share infographic, 9:16, titled 'Streaming Subscribers by Platform'. A vertical stacked-column layout where one tall bar splits into invented services: StreamNest 31%, PixelPlay 24%, LumaTV 18%, CineWave 15%, Others 12%, each segment labeled with a percentage and a

Cloud Provider Market Share
GPT Image 2en

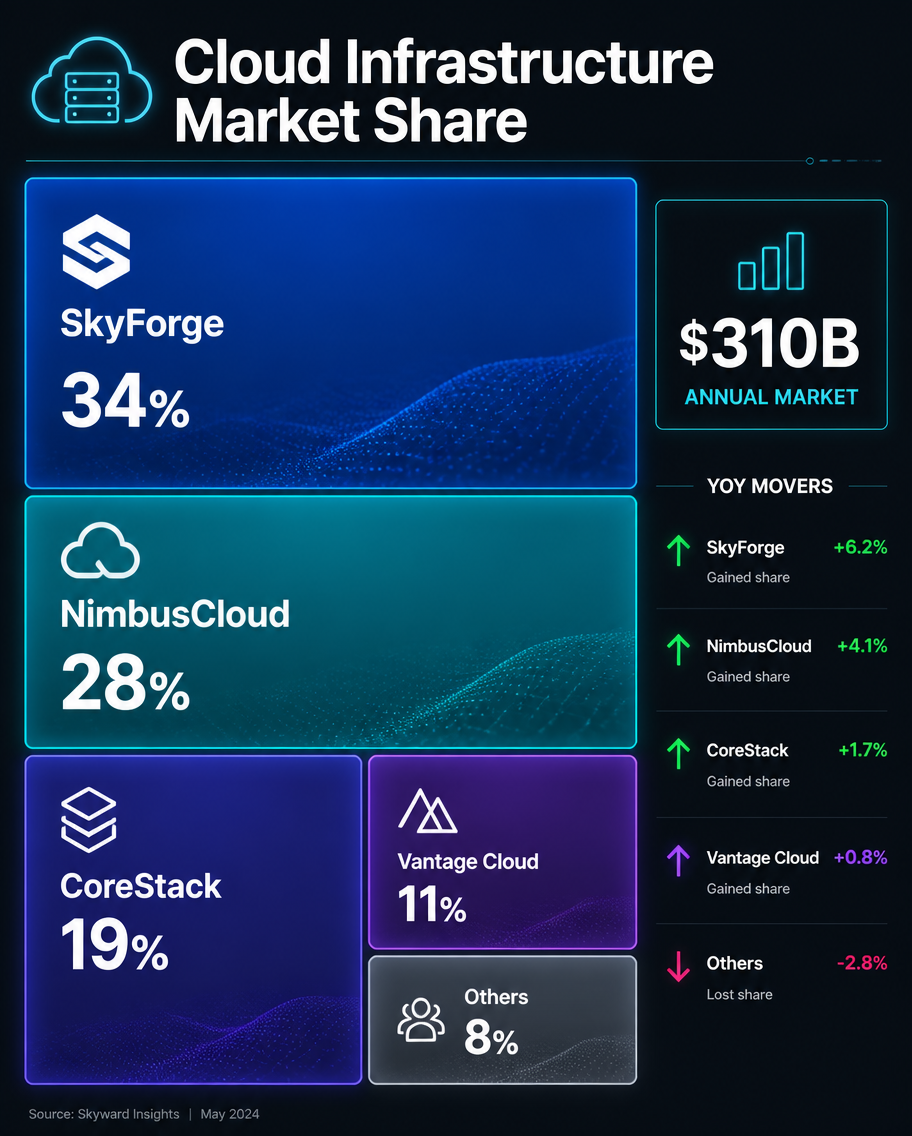
A tech market-share infographic, 4:5, titled 'Cloud Infrastructure Market Share'. A treemap-style block layout sizes invented providers by share: SkyForge 34% (large blue block), NimbusCloud 28% (teal), CoreStack 19% (indigo), Vantage Cloud 11% (purple), Others 8% (grey). Each bl

Social Platform Market Share
GPT Image 2en

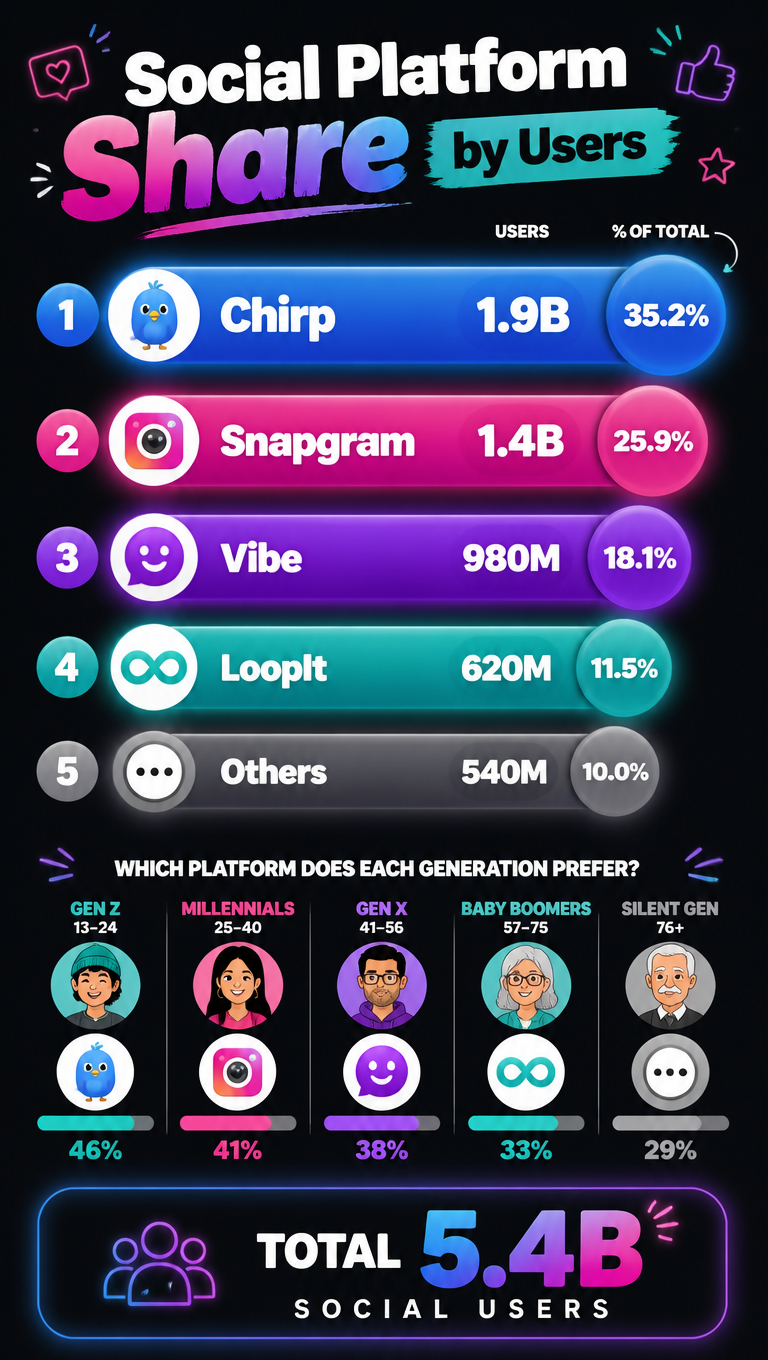
A social-media market-share infographic, 9:16, titled 'Social Platform Share by Users'. A vertical ranked layout: horizontal bubble bars for invented platforms sized by users: Chirp 1.9B (blue), Snapgram 1.4B (magenta), Vibe 980M (purple), LoopIt 620M (teal), Others 540M (grey),