Overview
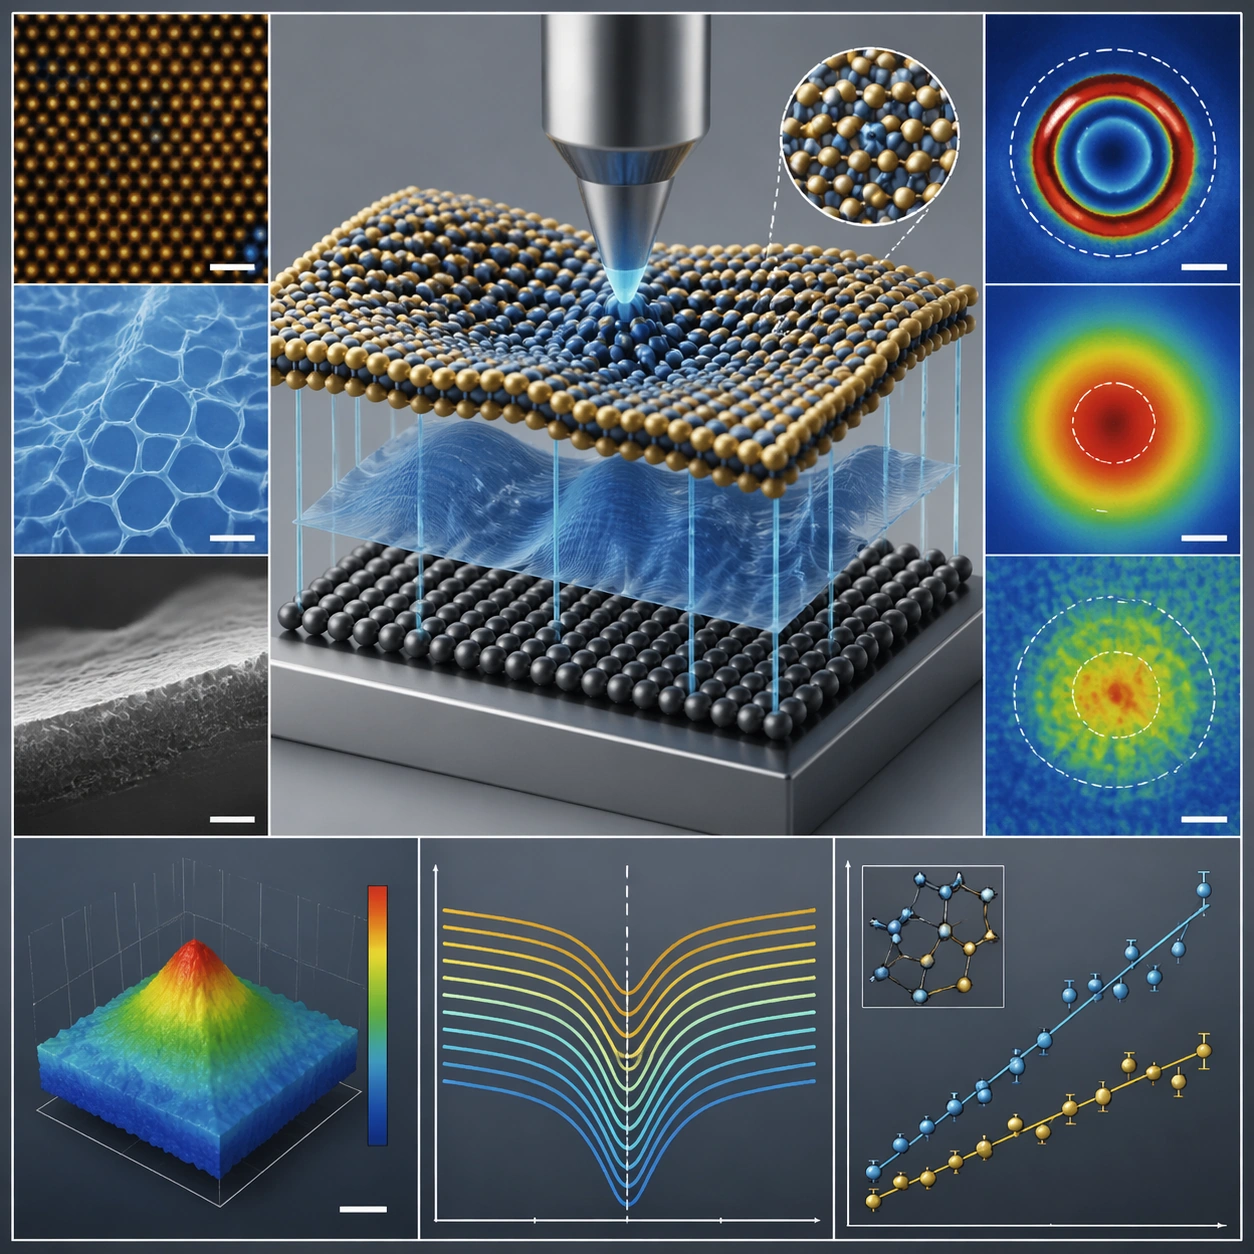
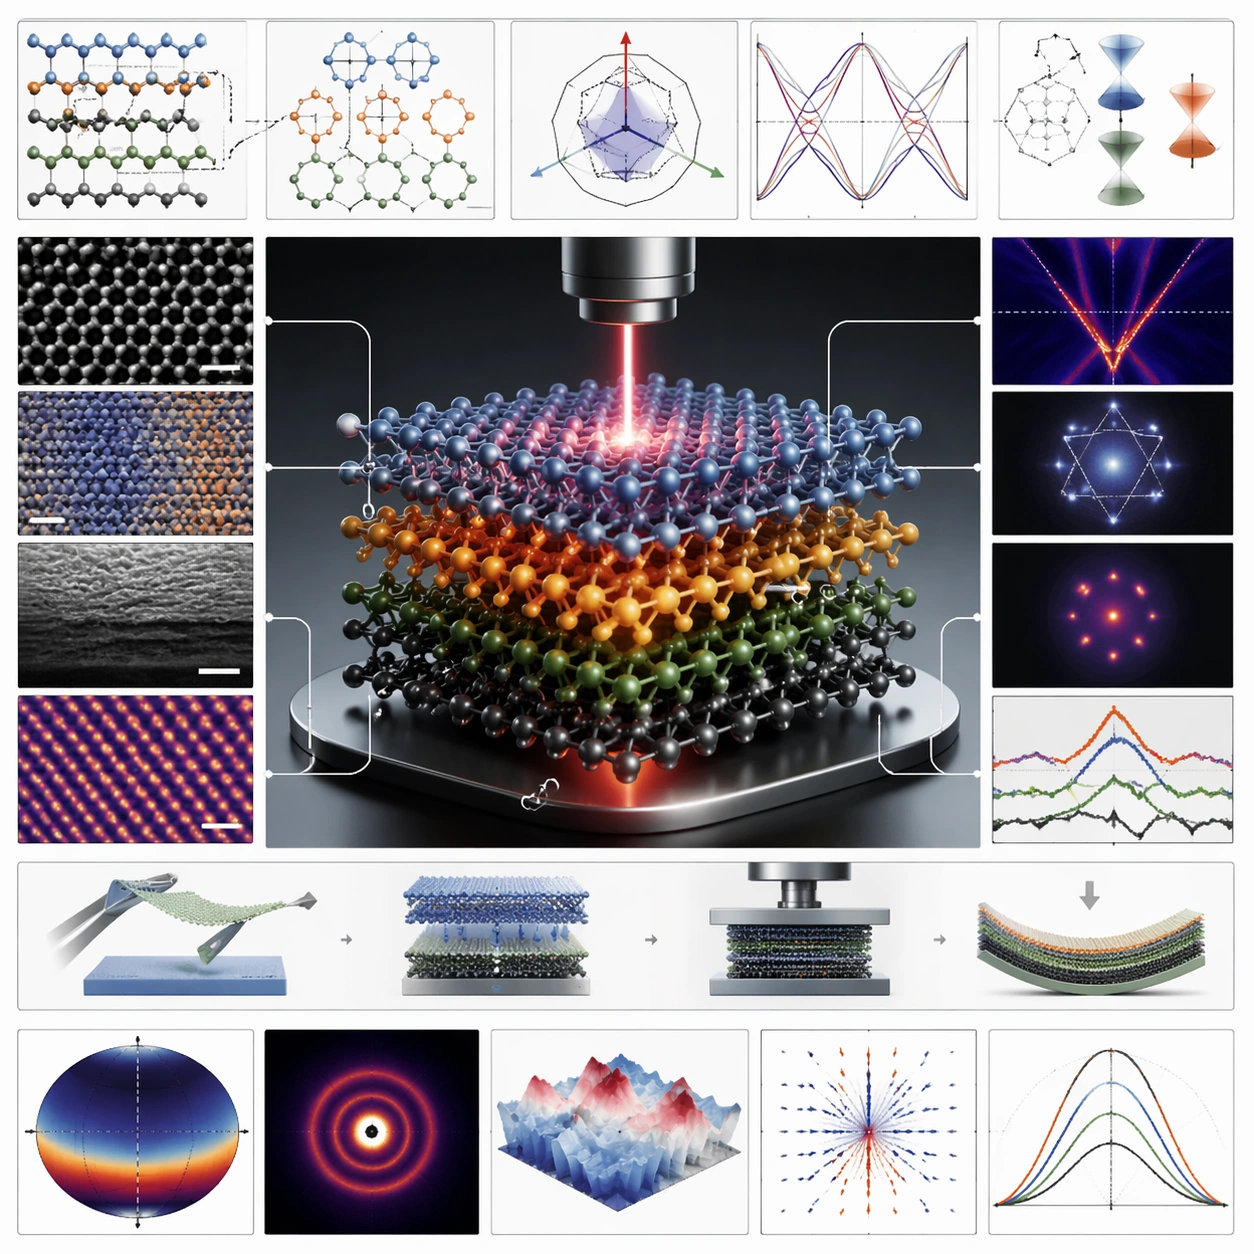
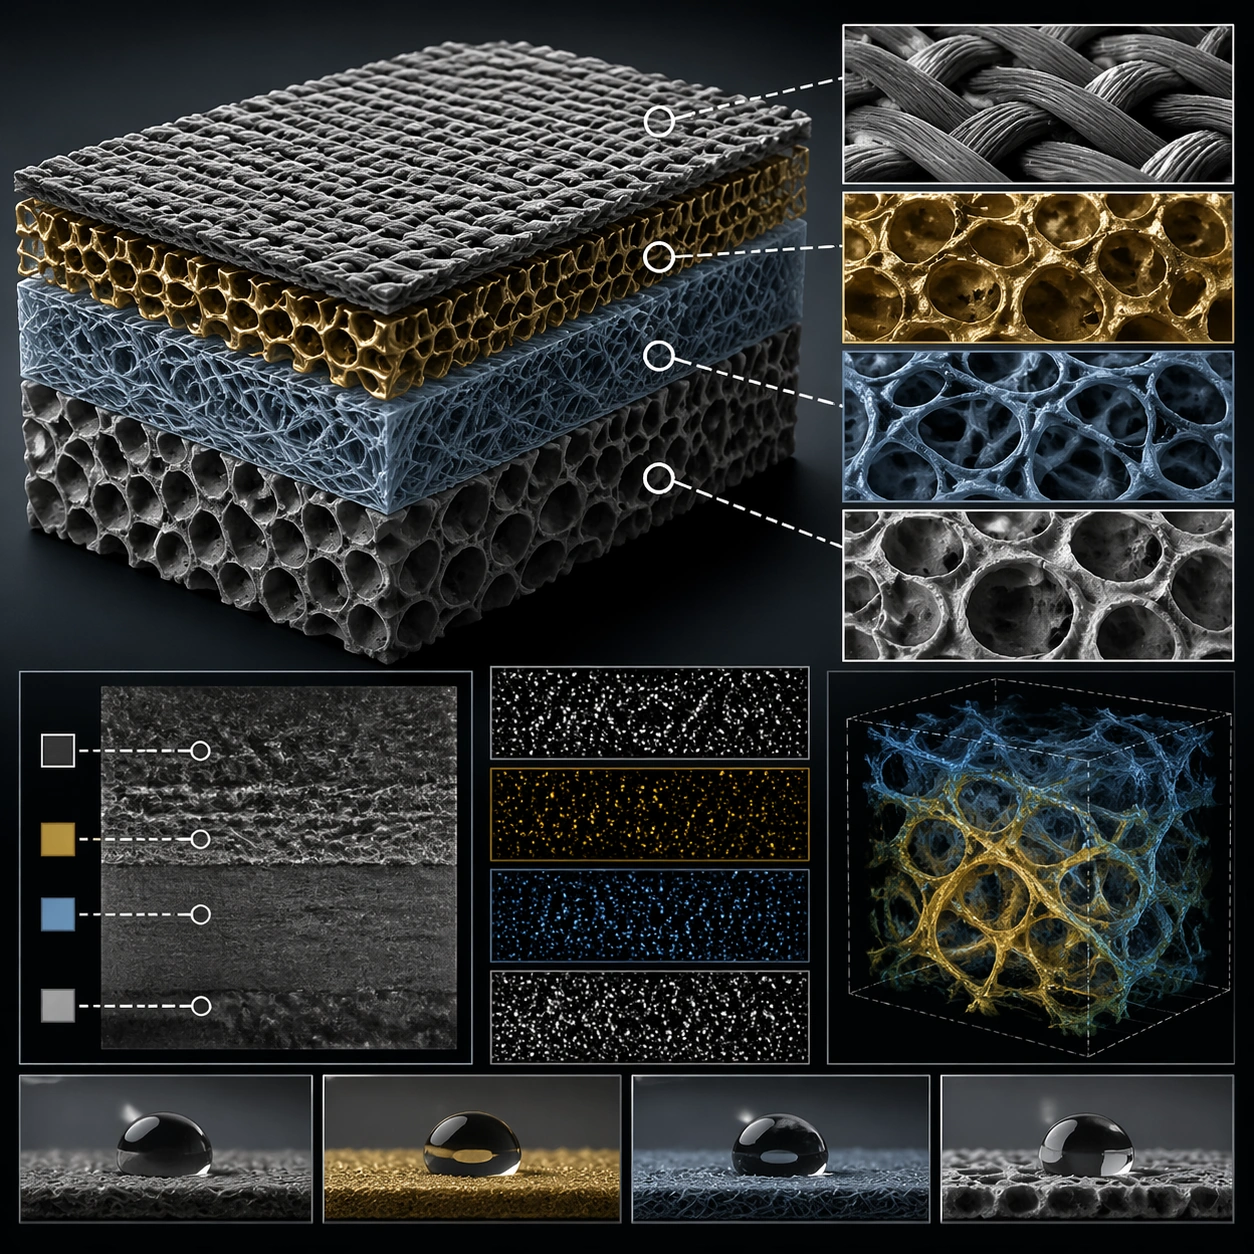
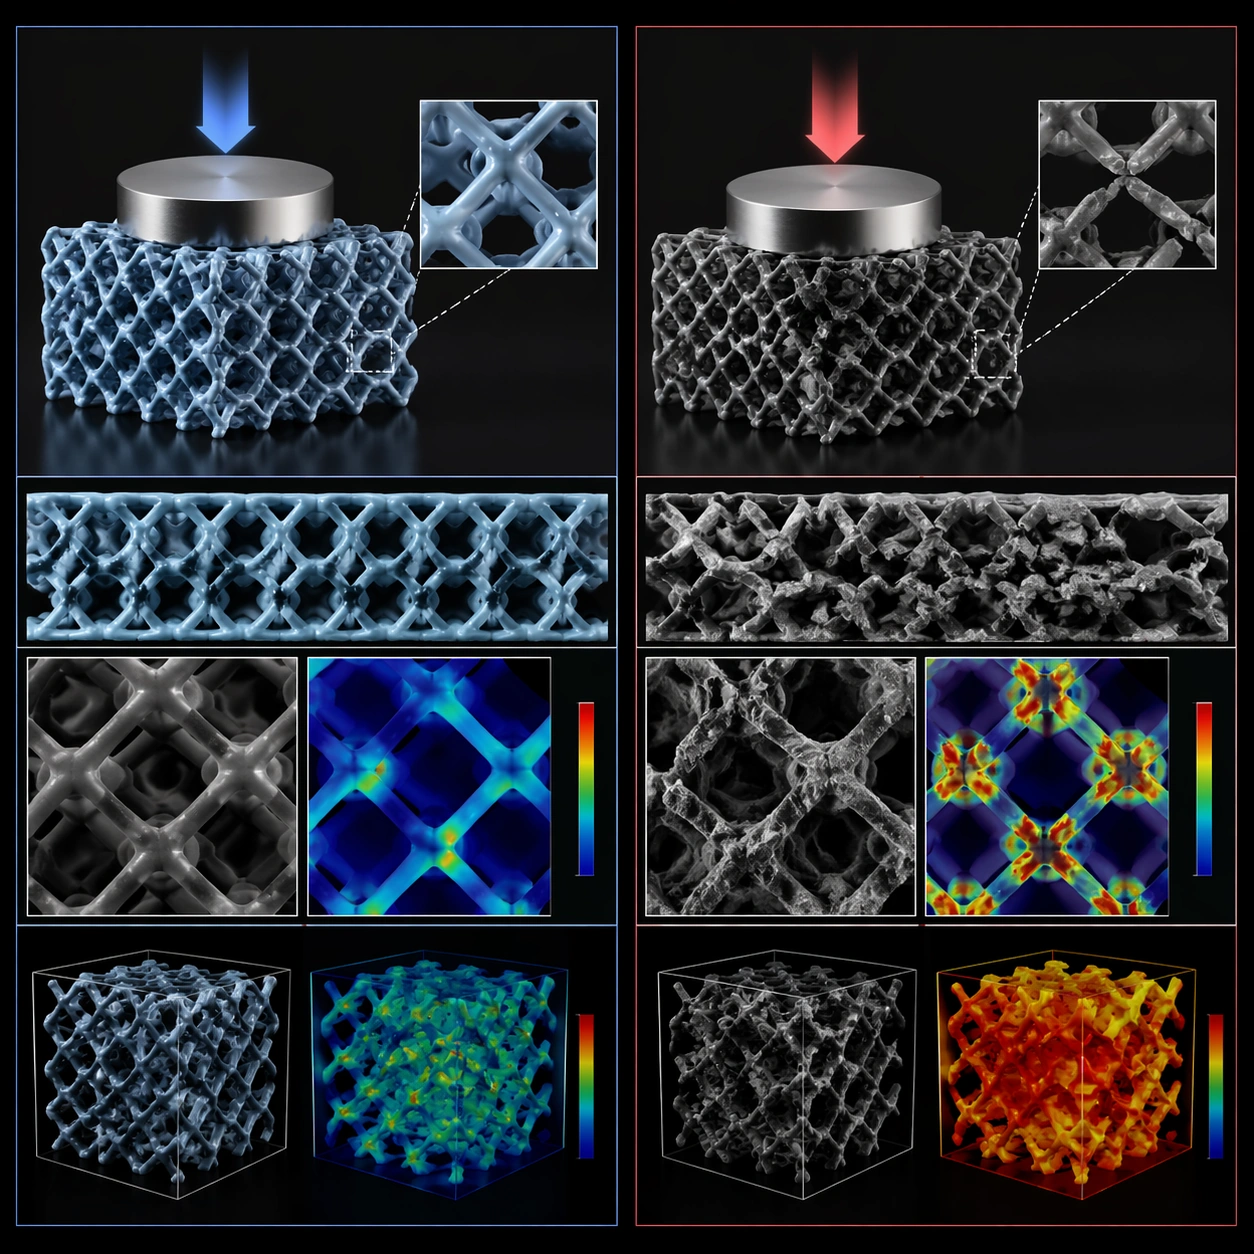
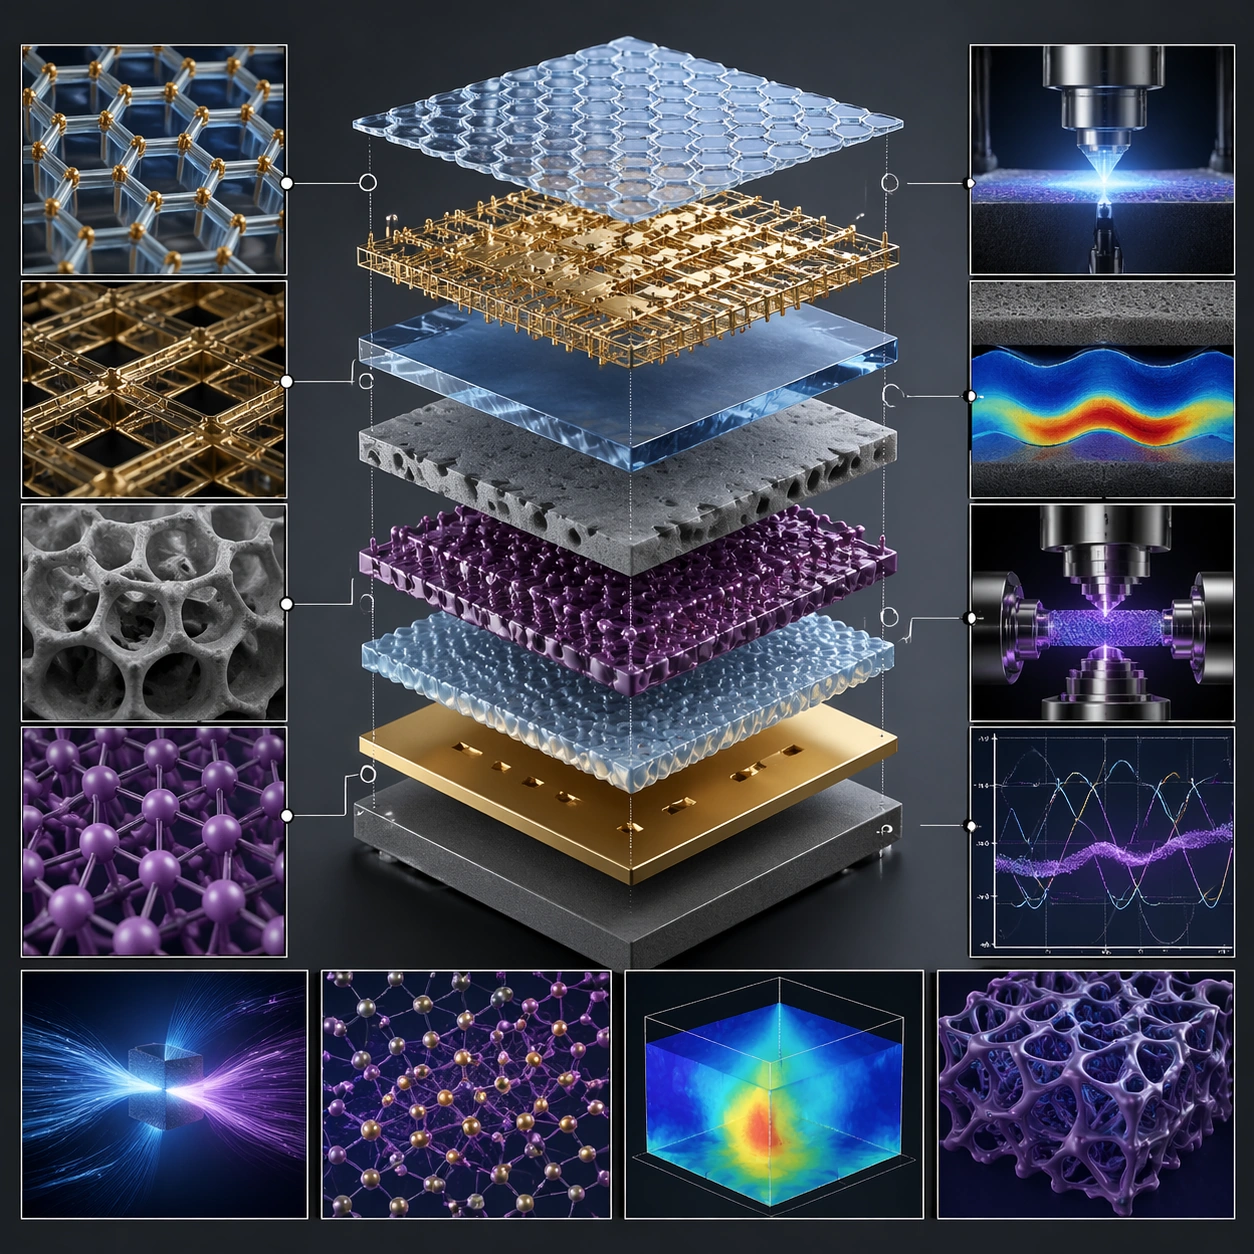
The composition separates a layered system along a shared vertical axis, making assembly order the main visual story. In the published example, transparent, metallic, porous and lattice-like layers occupy the center; close-up panels around the edges expand their textures and apparent functions. A dark ground and repeated blue, gold and purple tones keep many small panels connected to the central stack. This is useful as a concept illustration or presentation direction when the relationship between components matters more than a photorealistic object on its own.
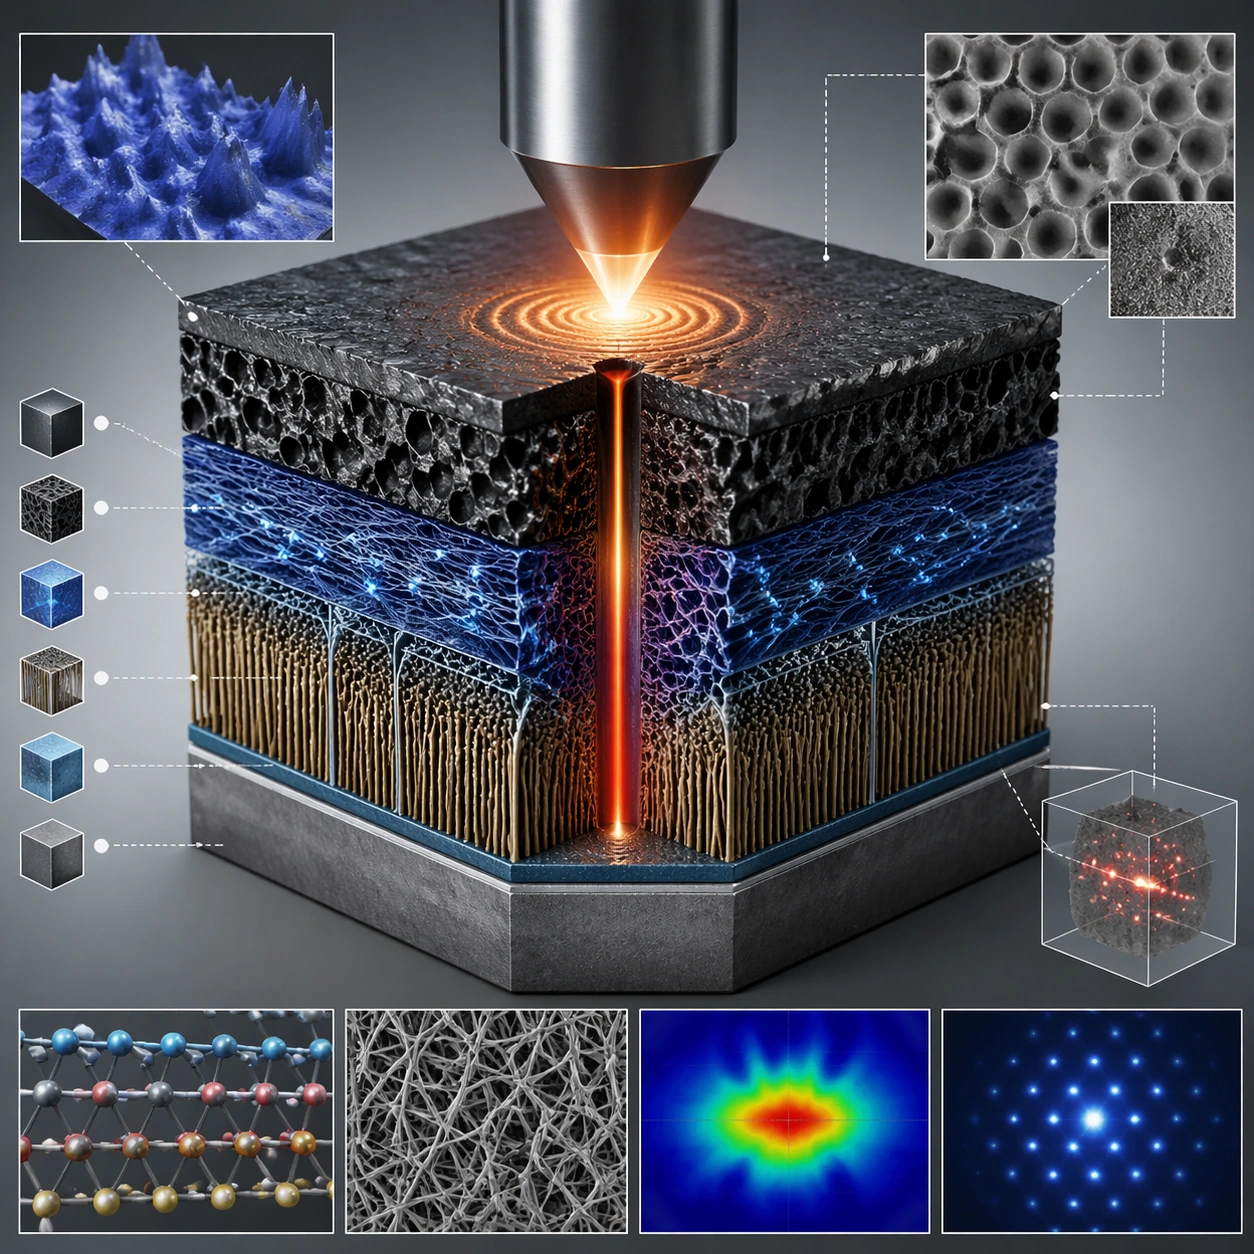
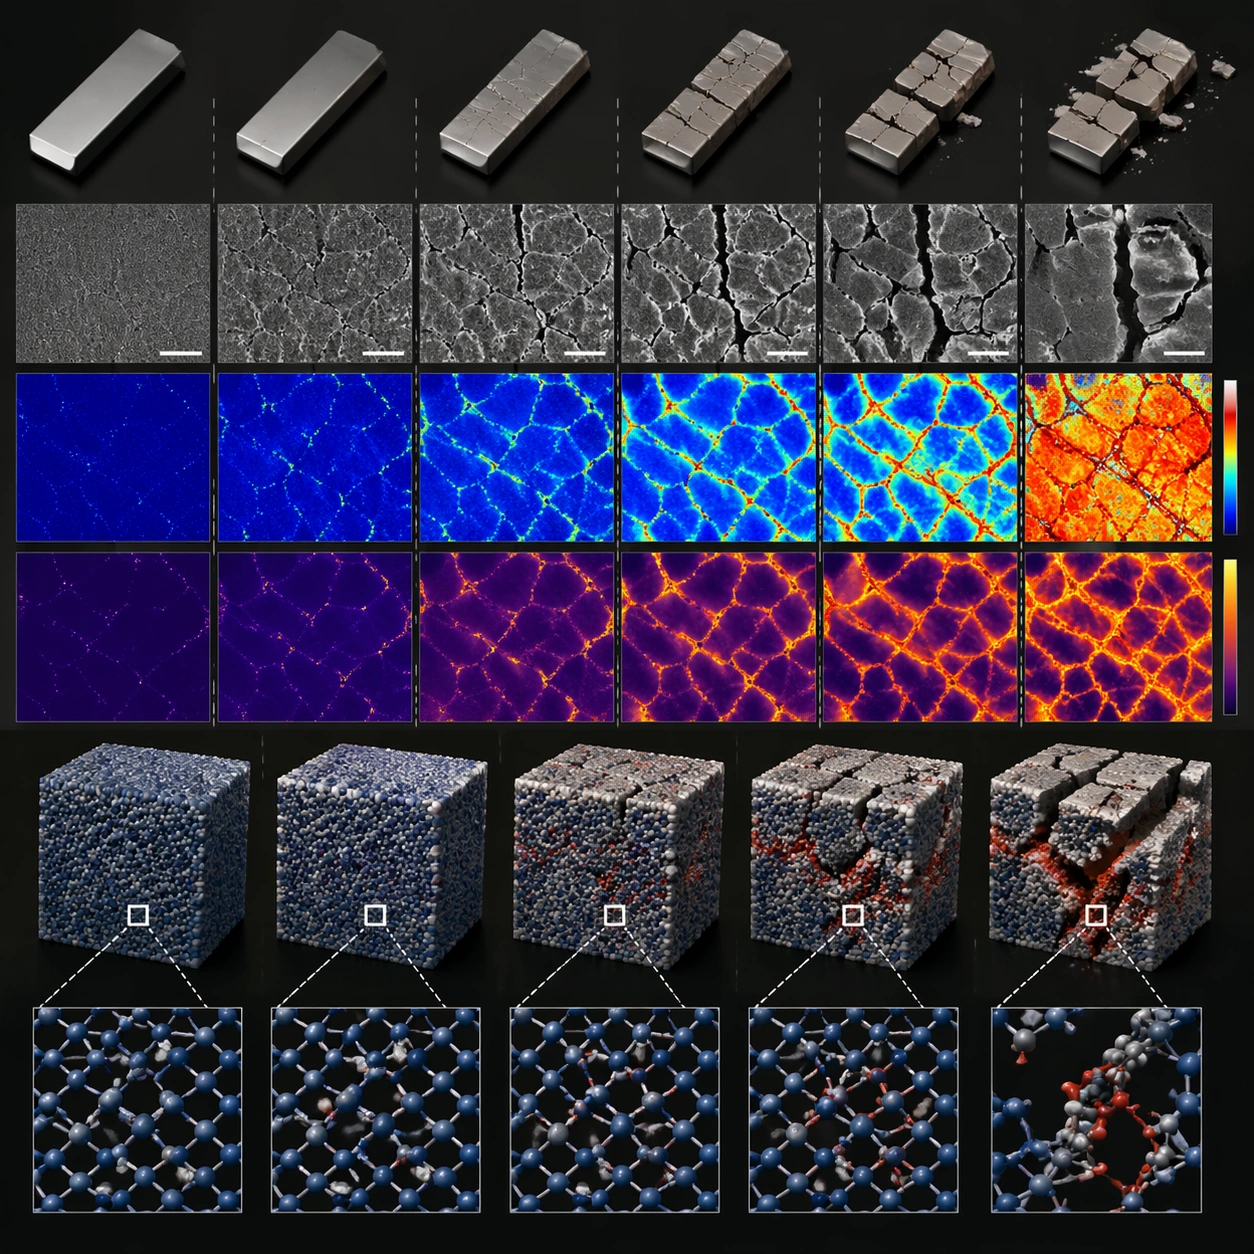
The source asks for no readable labels, although the example includes chart-like marks and heatmap-like panels. Those visual elements are generated illustration, not measured data or evidence that the proposed material works. For a technical deliverable, supply the actual component order, replace illustrative plots with verified figures where necessary, and typeset real labels separately. The square layout is a starting composition rather than a validated scientific diagram.
What to prepare
- The complete original prompt, plus your own material, component order and intended audience when adapting the concept.
- Verified labels or data for any technical annotations you intend to add after the illustration.
- No required reference-image dependency is recorded for this accepted source case; any reference you add is a separate adaptation.
What you get
- A 1:1 concept image organizing an exploded layer stack and supporting detail panels.
- An illustration to review and annotate, rather than experimental imagery or a reproducible engineering specification.
Suggested workflow
- Map the actual component order and choose which details deserve an inset. Replace the subject description when adapting, while keeping the saved original intact.
- Keep the central stack, clear spacing and square framing. The original requests no logos, watermarks or readable labels, so plan final typography separately.
- Inspect the full-size result for impossible connections, repeated components, misleading plots and callouts that point to the wrong layer.
- Add verified labels and source-backed data in a layout tool, then review both a thumbnail and the intended delivery size. Describe the image's illustrative role.
Limits and checks
- Layer order, attachment points and inset connections must agree with the subject you intend to explain.
- Generated graphs, heatmaps, microscopy-like textures and material appearances do not establish physical properties or measured results.
- Keep the principal stack legible at a small size; an attractive field of tiny panels can still obscure the explanation.
- The author metadata identifies GPT Image 2. The precise API variant and original generation were not independently reproduced.
Common questions
Can this be used as an experimental figure?
The saved output is a generated concept illustration. Use verified experimental data and accurate component relationships for a research figure, disclose the illustration's role as required by the publication, and check its rules. The gallery image is not a source of measurements.
How do I add real labels?
The original explicitly avoids readable text. A practical approach is to reserve space and typeset labels after the image is reviewed. If you change that constraint in a new prompt, keep the adaptation distinct from the complete source prompt shown here.
Is the displayed image a required input?
It is the author's published output example, not a required reference input recorded for this case. The complete prompt and output are preserved together; an identical regeneration is not promised.
Original document
GPT Image 2 · en
Scene:
A square plate or board viewed straight-on, with crisp organization, disciplined spacing, and premium print clarity. Build the frame around components separated clearly enough to reveal construction and dependency. Keep the lighting, camera distance, and spatial organization tuned for a high-signal research image rather than a casual snapshot. The image belongs to the Scientific Paper Figure theme and should feel immediately legible as a prompt atlas theme for scientific paper figure, testing physics-materials, commercial-mockup with gpt image 2..

Subject:
Center the study on components separated clearly enough to reveal construction and dependency. Translate the theme into a concrete visual statement instead of an abstract mood board: the viewer should understand what kind of image this is, what is being tested, and why the composition is difficult. Use the slug idea of scientific paper figure as a literal guide for subject matter, materials, and staging. If helpful, borrow the broad visual cues suggested by Nature, Science, but keep the result original and specific to this study.

Important details:
The image should communicate logic through grouping, hierarchy, callouts, insets, and believable professional layout discipline rather than decorative noise. Preserve a disciplined square composition, clear focal hierarchy, and enough secondary information to make the image feel complete rather than underspecified. The image should look polished, novel, and exhibition-ready, with topic-specific credibility coming from the way surfaces, structure, and visual language reinforce Scientific Paper Figure. Avoid generic filler elements that do not serve the main concept.

Use case:
Scientific Paper Figure single study 7/8, testing physics-materials, commercial-mockup through the exploded system variation.

Constraints:
No readable text, no watermark, no logos, preserve exact 1:1 aspect ratio, no readable labels, no messy arrows, no random infographic decoration, no fake UI chrome unless the topic calls for it, no broken alignment, no meaningless clutter.