Documento original
GPT Image 2 · en
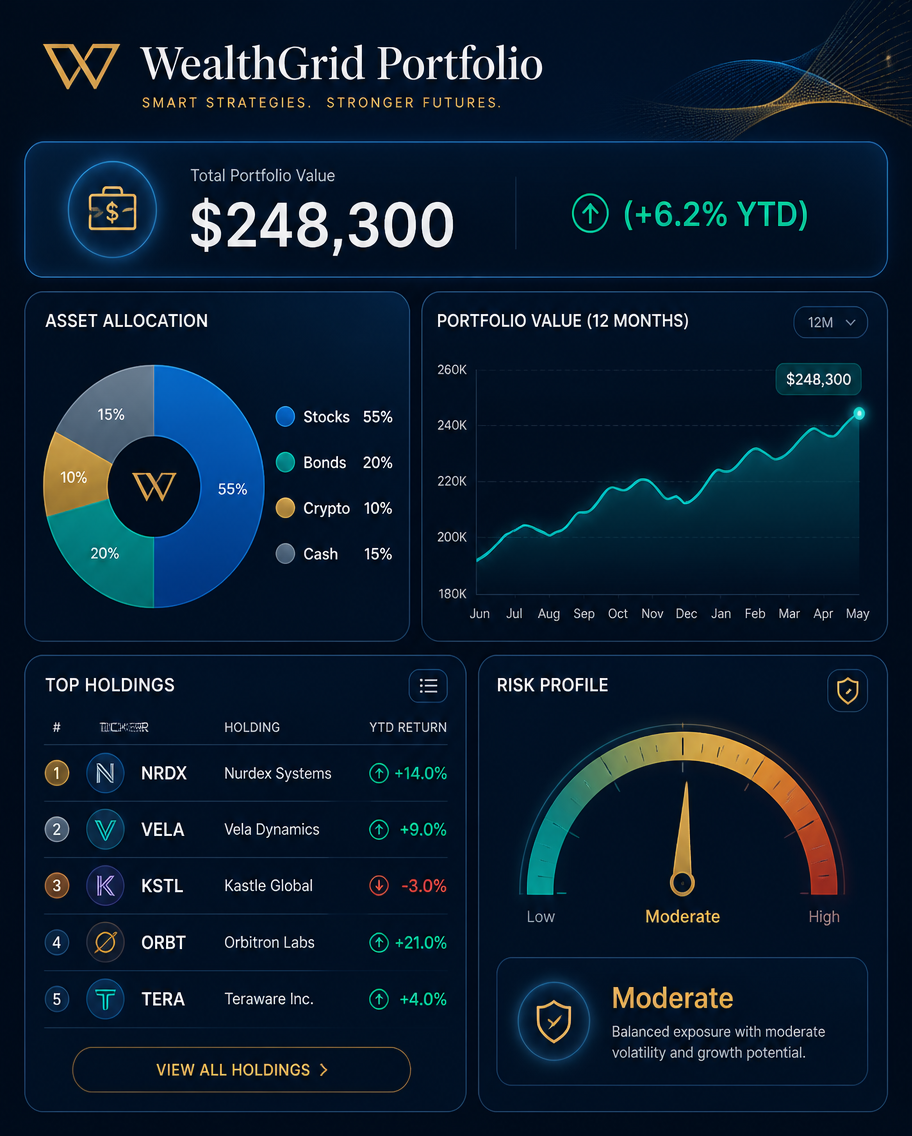
A finance dashboard infographic, 4:5, titled 'WealthGrid Portfolio'. A report slide with a header value 'Total $248,300 (+6.2% YTD)'. A donut shows allocation (Stocks 55%, Bonds 20%, Crypto 10%, Cash 15%), a line chart tracks portfolio value over 12 months, and a ranked holdings list of five invented tickers (NRDX +14%, VELA +9%, KSTL -3%, ORBT +21%, TERA +4%) with green/red arrows. A risk gauge points to 'Moderate'. Deep navy-and-white palette, gold and teal accents, rounded widgets, subtle glow, premium clean fintech-dashboard aesthetic.Cómo usar
- Copia el prompt original completo, incluidos los parámetros.
- Adapta el tema, el texto y la composición a tus necesidades.
- Usa una herramienta externa compatible; comprueba el acceso y el resultado.
Antes de empezar
- Comprueba si necesita una imagen de referencia. La compatibilidad no demuestra qué modelo generó el ejemplo.
- Revisa nombres, cifras y textos; el resultado puede variar entre versiones del modelo.