Documento original
GPT Image 2 · en
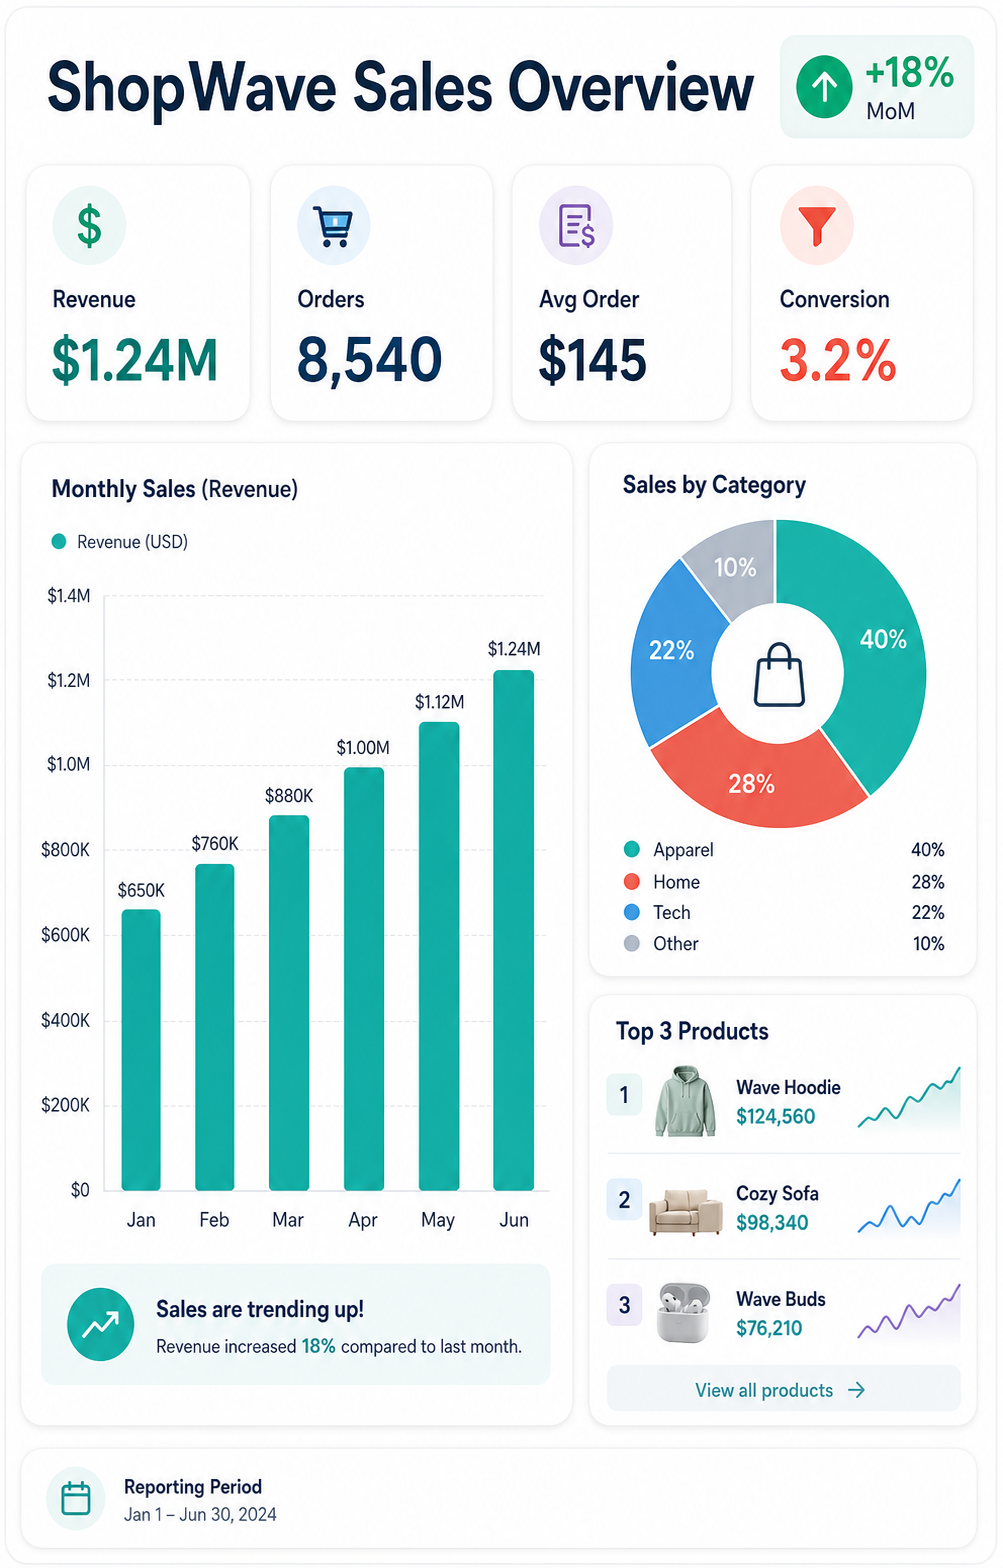
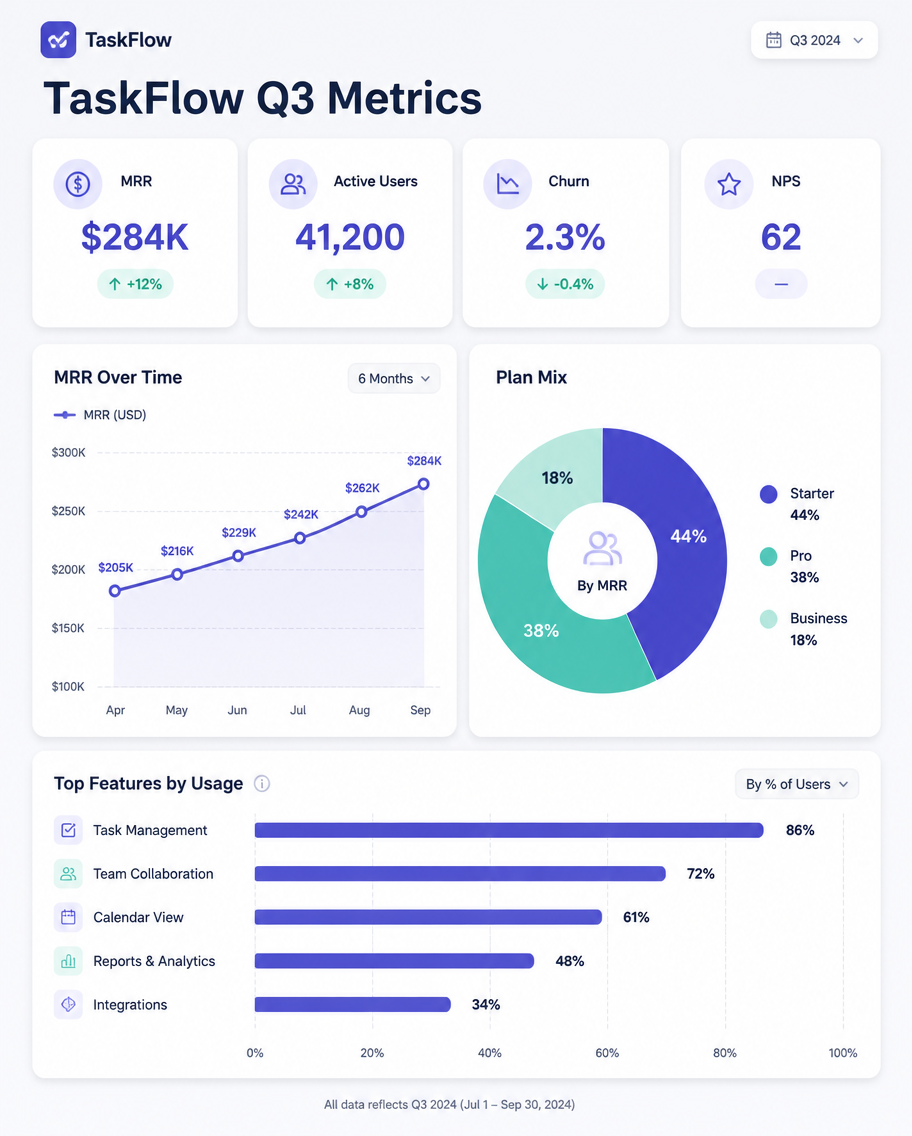
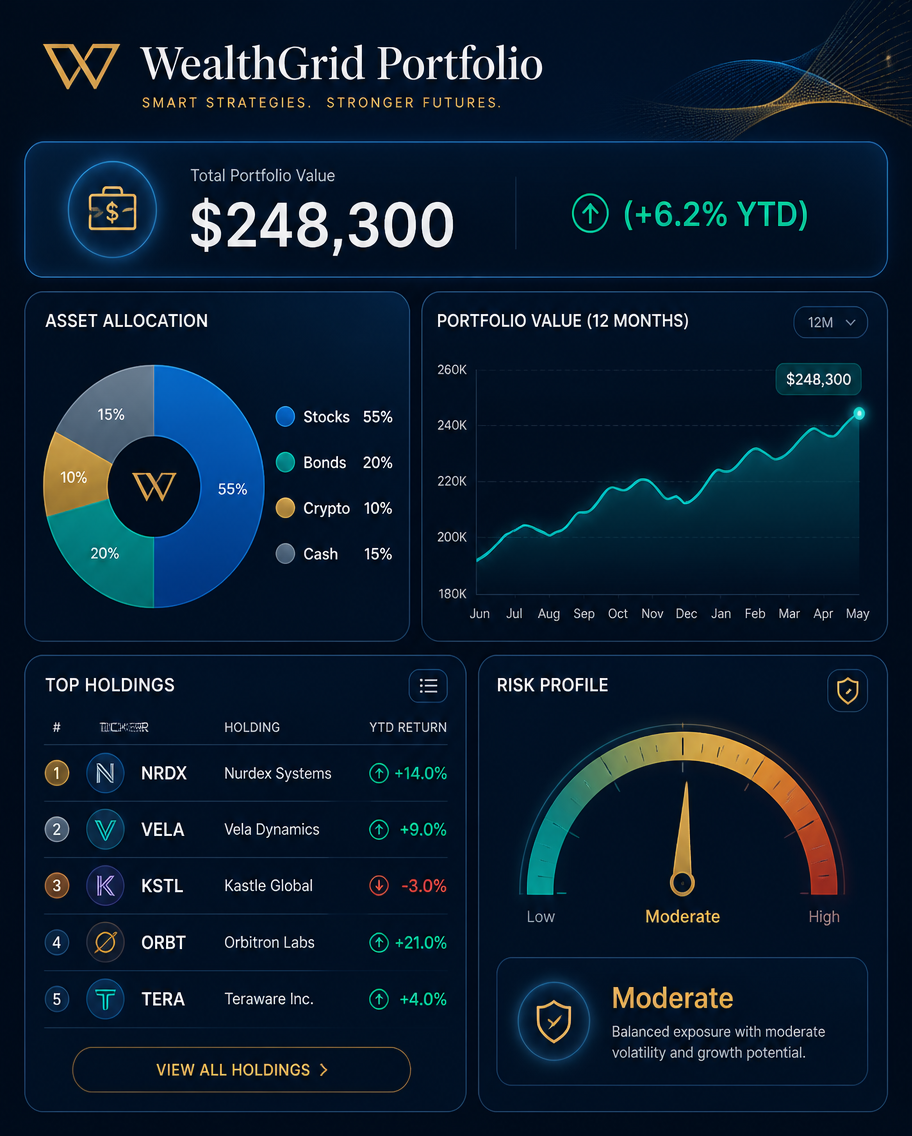
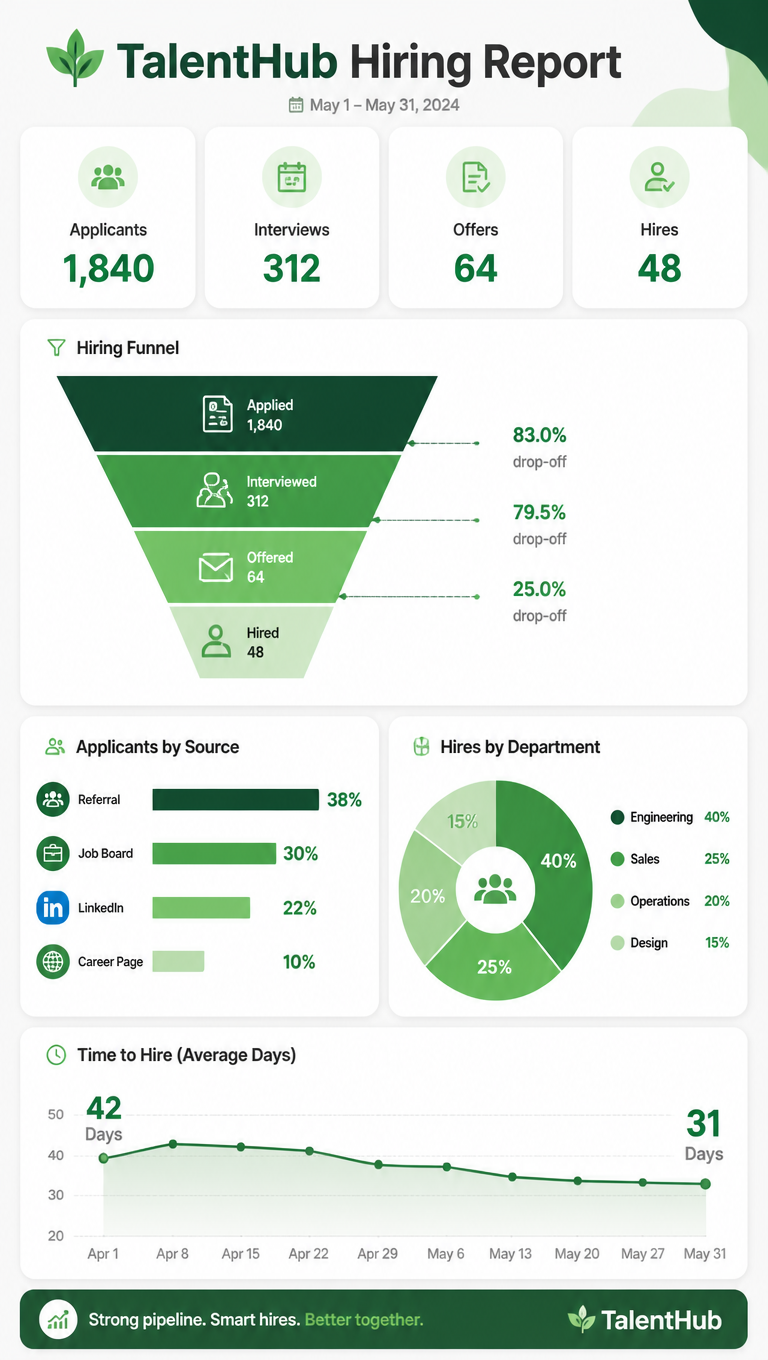
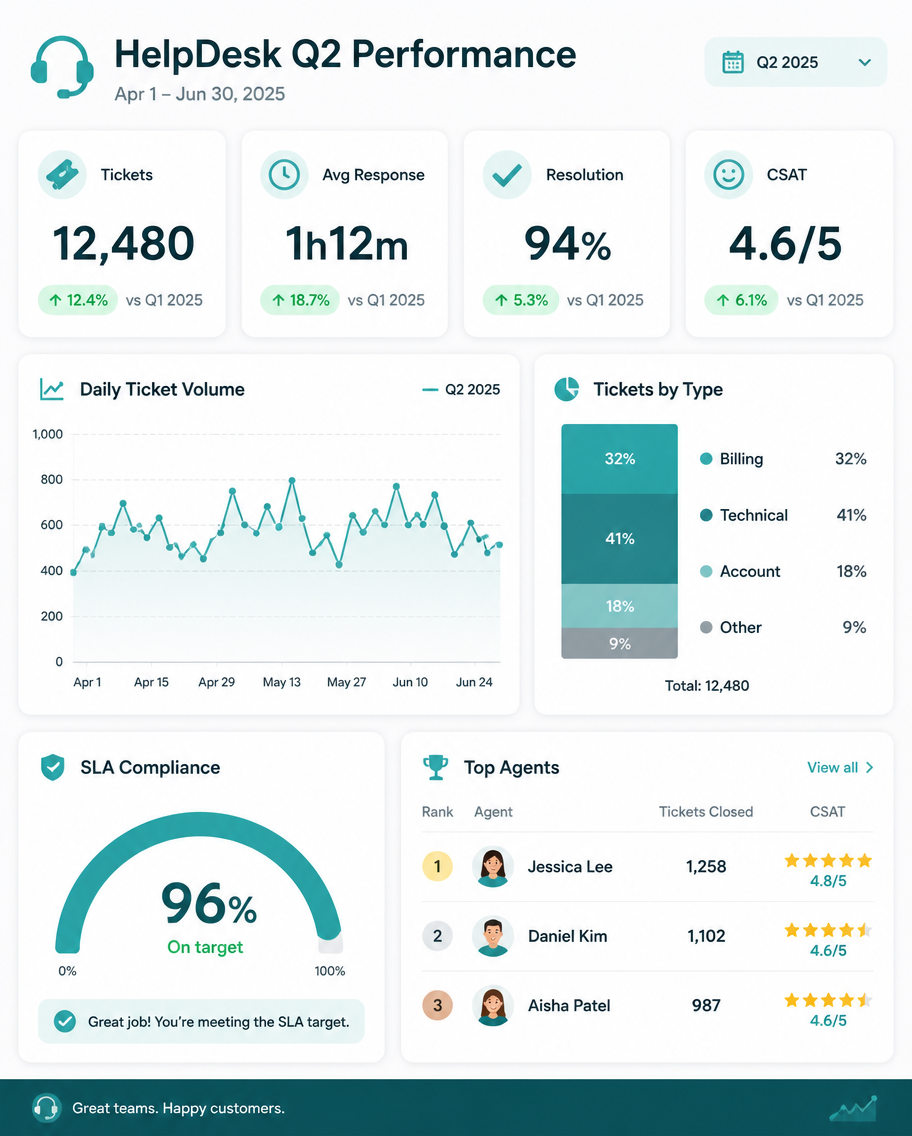
A dashboard infographic, 4:5, titled 'HelpDesk Q2 Performance'. A report slide with four KPI cards: Tickets 12,480, Avg Response 1h12m, Resolution 94%, CSAT 4.6/5. A line chart tracks daily ticket volume, a stacked bar splits ticket type (Billing 32%, Technical 41%, Account 18%, Other 9%), and a gauge shows SLA compliance at 96%. A small agent-leaderboard card lists three top performers with star ratings. Calm teal-and-white palette, rounded widgets on a light grid, green trend badges, tidy professional support-dashboard aesthetic.Cómo usar
- Copia el prompt original completo, incluidos los parámetros.
- Adapta el tema, el texto y la composición a tus necesidades.
- Usa una herramienta externa compatible; comprueba el acceso y el resultado.
Antes de empezar
- Comprueba si necesita una imagen de referencia. La compatibilidad no demuestra qué modelo generó el ejemplo.
- Revisa nombres, cifras y textos; el resultado puede variar entre versiones del modelo.