原始文档
GPT Image 2 · en
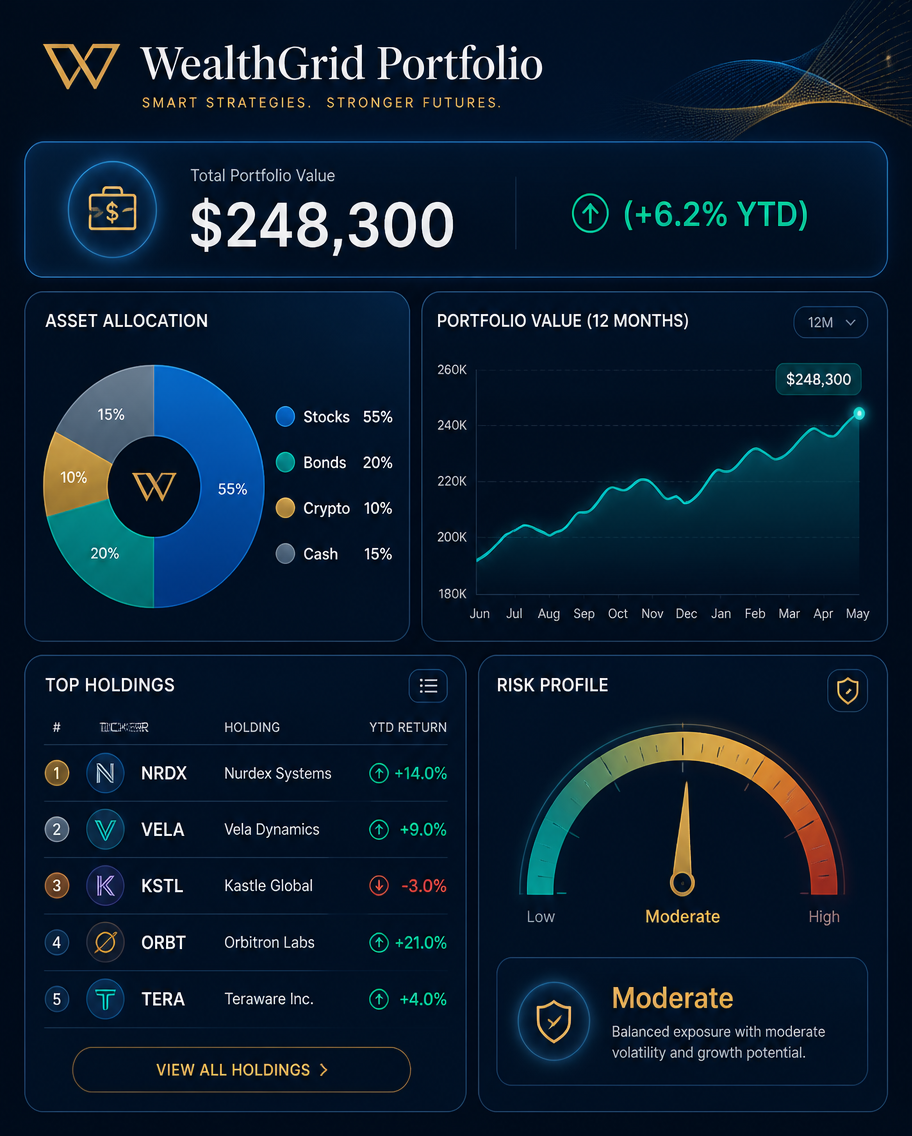
A finance dashboard infographic, 4:5, titled 'WealthGrid Portfolio'. A report slide with a header value 'Total $248,300 (+6.2% YTD)'. A donut shows allocation (Stocks 55%, Bonds 20%, Crypto 10%, Cash 15%), a line chart tracks portfolio value over 12 months, and a ranked holdings list of five invented tickers (NRDX +14%, VELA +9%, KSTL -3%, ORBT +21%, TERA +4%) with green/red arrows. A risk gauge points to 'Moderate'. Deep navy-and-white palette, gold and teal accents, rounded widgets, subtle glow, premium clean fintech-dashboard aesthetic.使用方法
- 复制完整原始提示词,并保留其中的参数。
- 按需求替换主体、文字和构图要求。
- 在兼容的外部工具中使用,核对当前使用条件并检查结果。
开始前需了解
- 先确认是否需要参考图。标注兼容模型,不代表该示例由这个模型生成。
- 核对名称、数字与画面文字;不同模型版本的结果可能不同。