Original document
GPT Image 2 · en
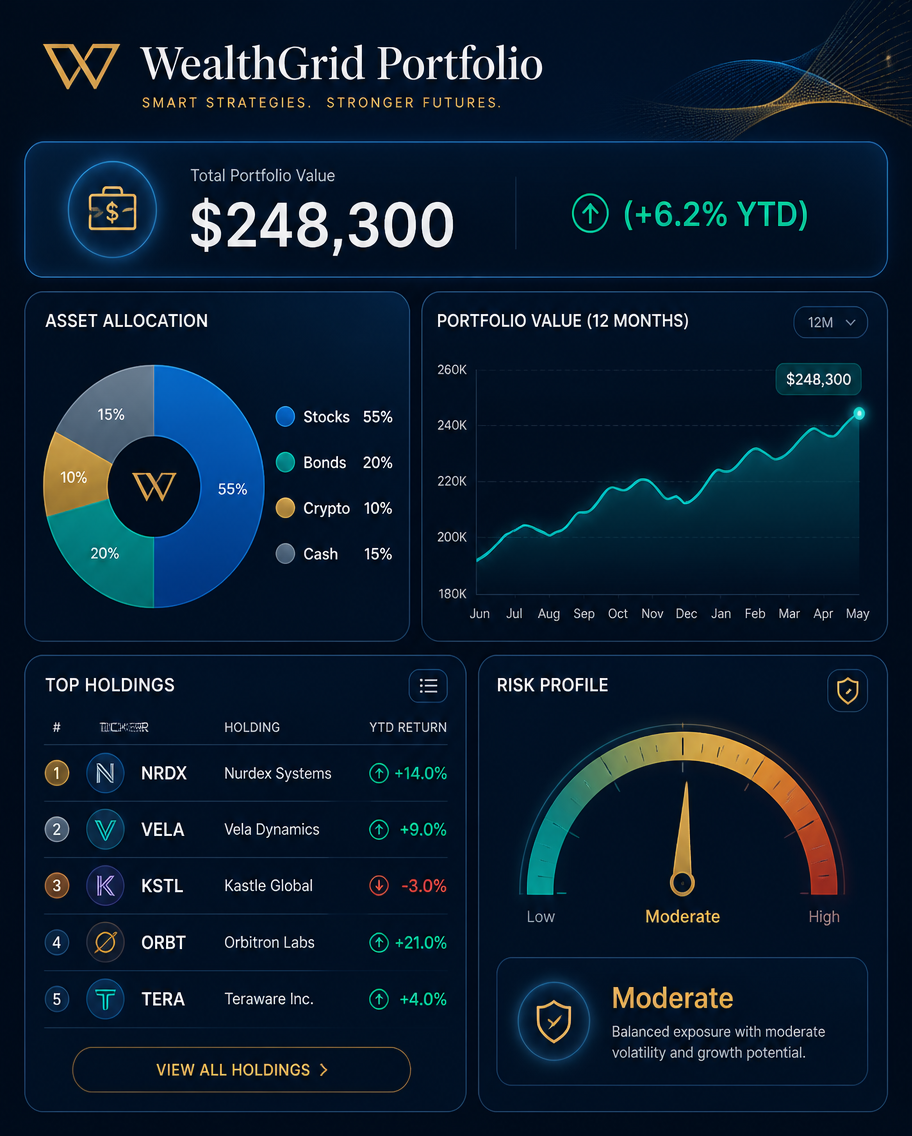
A finance dashboard infographic, 4:5, titled 'WealthGrid Portfolio'. A report slide with a header value 'Total $248,300 (+6.2% YTD)'. A donut shows allocation (Stocks 55%, Bonds 20%, Crypto 10%, Cash 15%), a line chart tracks portfolio value over 12 months, and a ranked holdings list of five invented tickers (NRDX +14%, VELA +9%, KSTL -3%, ORBT +21%, TERA +4%) with green/red arrows. A risk gauge points to 'Moderate'. Deep navy-and-white palette, gold and teal accents, rounded widgets, subtle glow, premium clean fintech-dashboard aesthetic.How to use
- Copy the complete original prompt, including any parameters.
- Replace the subject, text and composition with your own requirements.
- Use a compatible external tool; check its current access conditions and review the result.
Before you start
- Check whether a reference image is required. A compatible model label does not mean this example was generated with that model.
- Keep names, figures and visible text accurate; results can vary between model versions.