Document original
GPT Image 2 · en
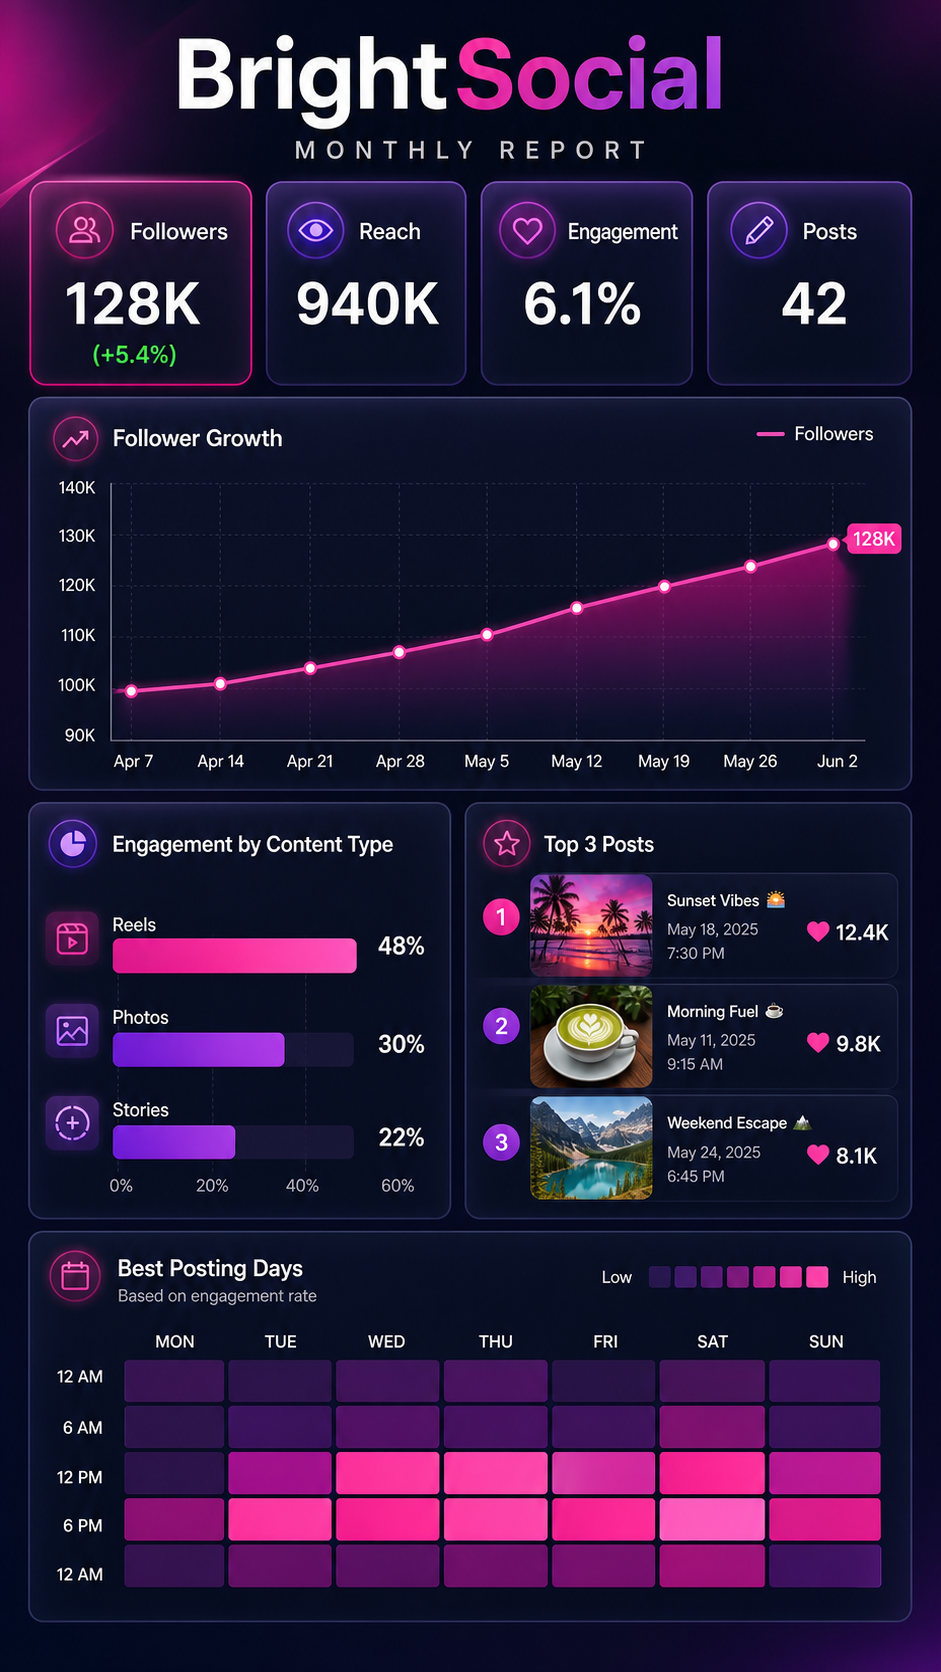
A dashboard infographic, 9:16, titled 'BrightSocial Monthly Report'. A vertical report with a KPI strip: Followers 128K (+5.4%), Reach 940K, Engagement 6.1%, Posts 42. Below, a line chart of follower growth, a horizontal bar of engagement by content type (Reels 48%, Photos 30%, Stories 22%), and a top-3 posts card with tiny thumbnails and like counts. A calendar heatmap shows best posting days. Vibrant magenta-and-purple gradient accents, dark card backgrounds, rounded widgets, glowing highlights, trendy social-analytics dashboard aesthetic.Mode d’emploi
- Copiez le prompt original complet, paramètres compris.
- Adaptez le sujet, le texte et la composition à vos besoins.
- Utilisez un outil externe compatible ; vérifiez l’accès et le résultat.
Avant de commencer
- Vérifiez si une image de référence est nécessaire. La compatibilité ne prouve pas le modèle utilisé pour cet exemple.
- Vérifiez noms, chiffres et textes ; les versions du modèle peuvent produire des résultats différents.