Documento originale
GPT Image 2 · en
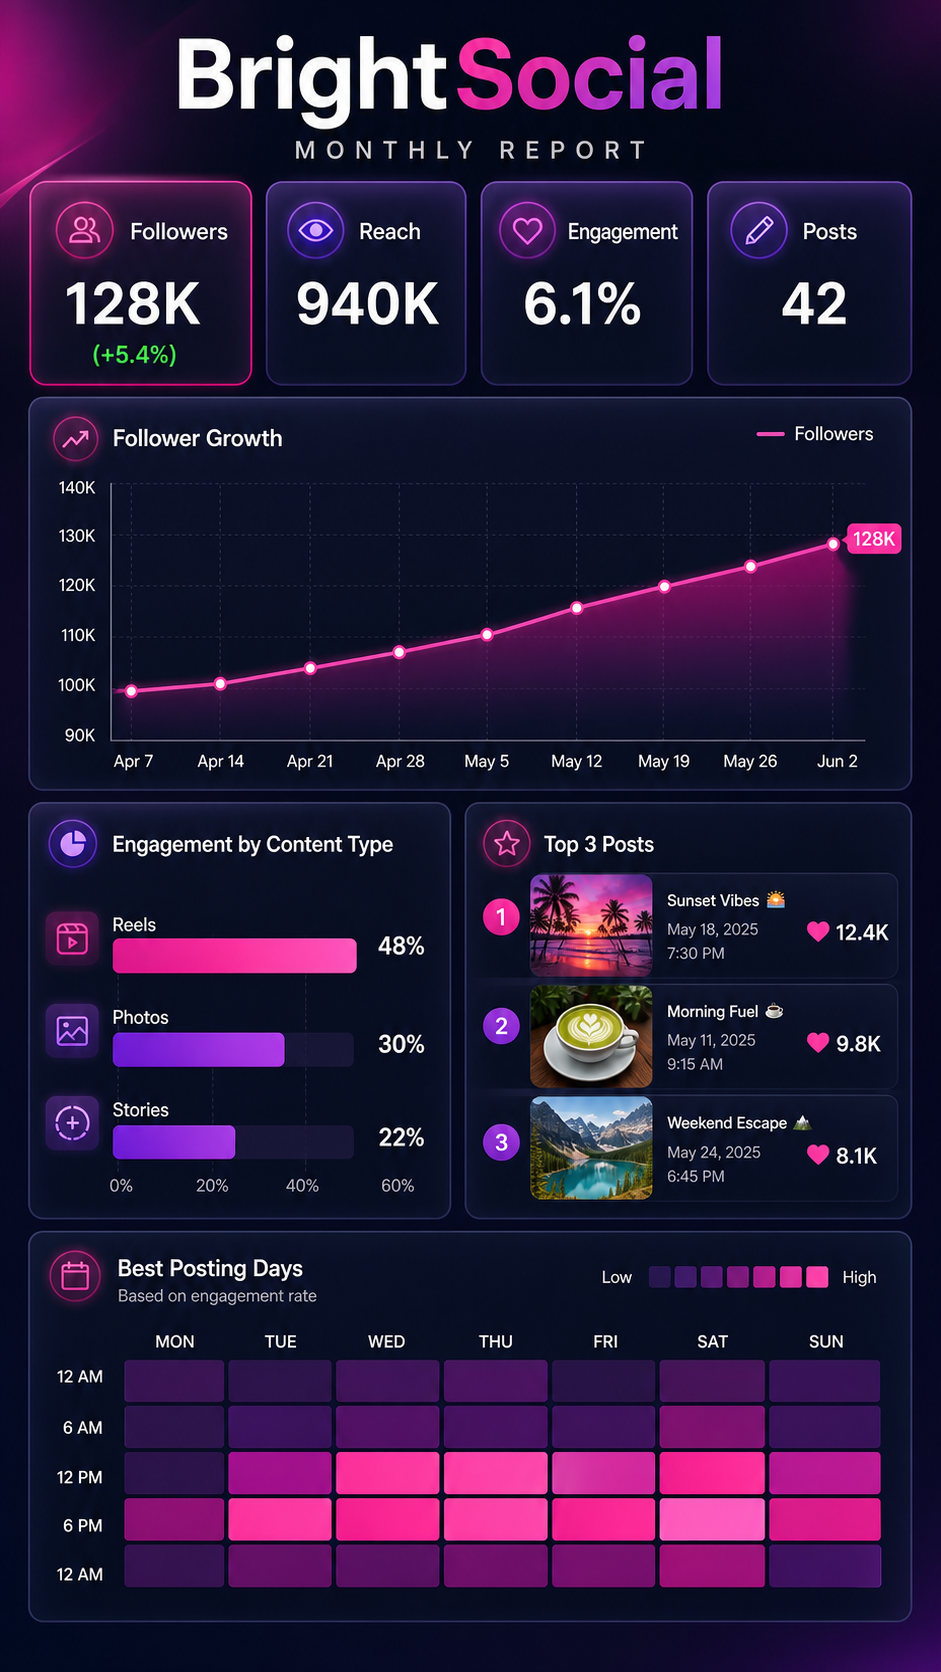
A dashboard infographic, 9:16, titled 'BrightSocial Monthly Report'. A vertical report with a KPI strip: Followers 128K (+5.4%), Reach 940K, Engagement 6.1%, Posts 42. Below, a line chart of follower growth, a horizontal bar of engagement by content type (Reels 48%, Photos 30%, Stories 22%), and a top-3 posts card with tiny thumbnails and like counts. A calendar heatmap shows best posting days. Vibrant magenta-and-purple gradient accents, dark card backgrounds, rounded widgets, glowing highlights, trendy social-analytics dashboard aesthetic.Come usare
- Copia tutto il prompt originale, inclusi i parametri.
- Adatta soggetto, testo e composizione alle tue esigenze.
- Usa uno strumento esterno compatibile; verifica accesso e risultato.
Prima di iniziare
- Controlla se serve un’immagine di riferimento. La compatibilità non prova il modello usato per l’esempio.
- Verifica nomi, numeri e testi; i risultati cambiano con le versioni del modello.