Original document
GPT Image 2 · en
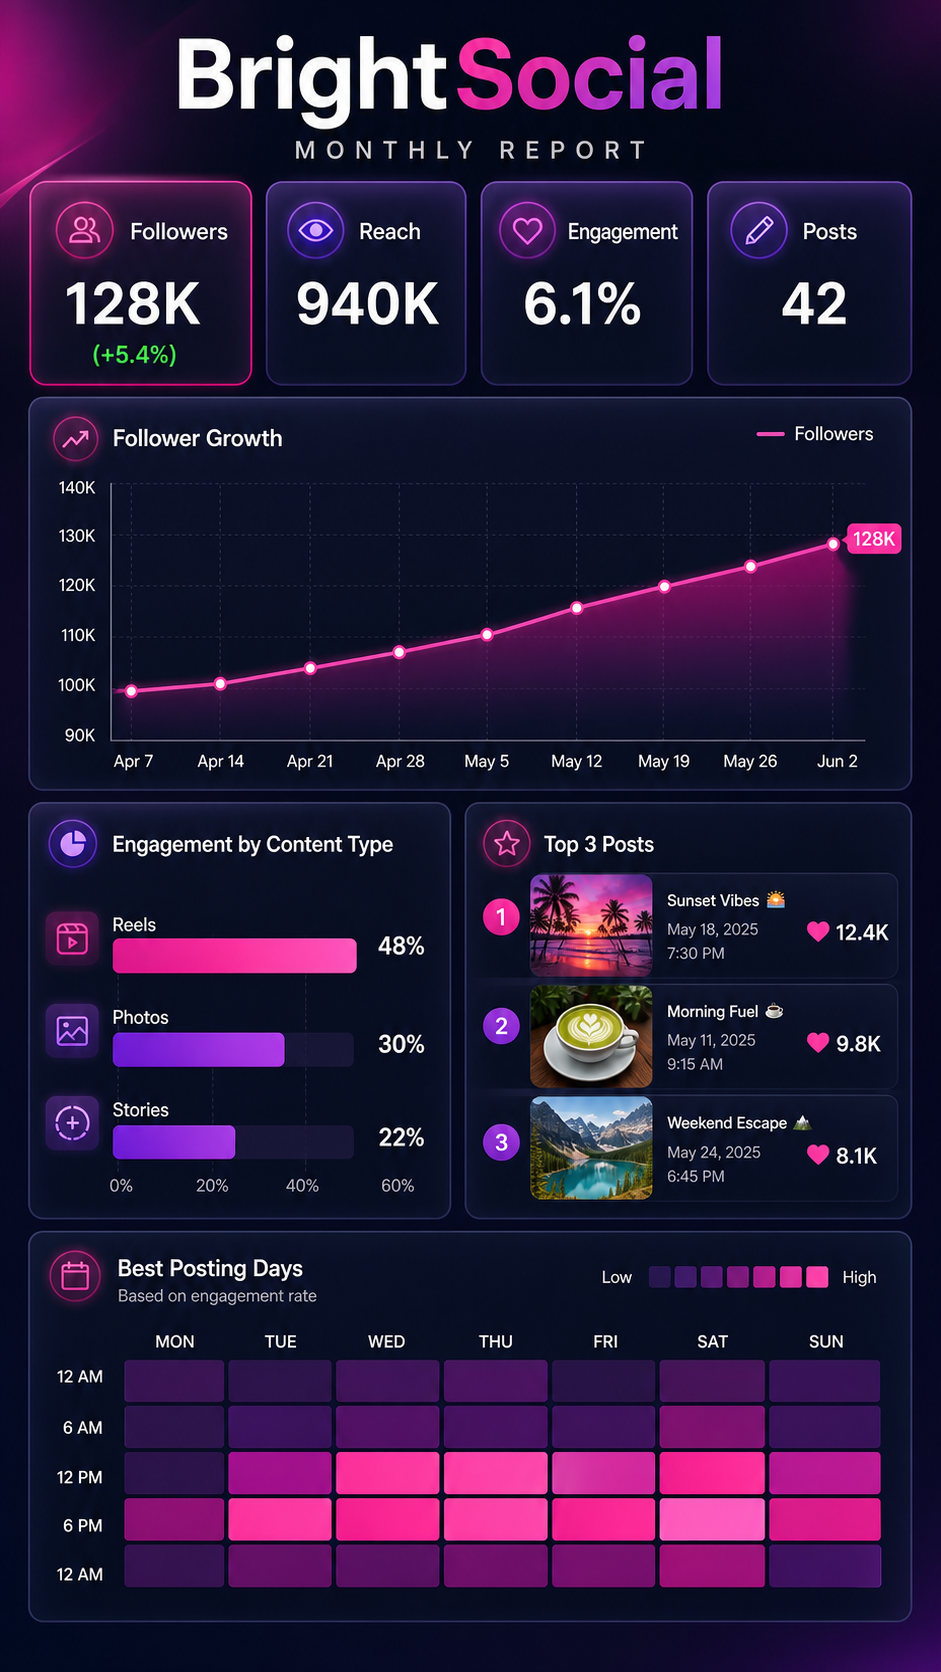
A dashboard infographic, 9:16, titled 'BrightSocial Monthly Report'. A vertical report with a KPI strip: Followers 128K (+5.4%), Reach 940K, Engagement 6.1%, Posts 42. Below, a line chart of follower growth, a horizontal bar of engagement by content type (Reels 48%, Photos 30%, Stories 22%), and a top-3 posts card with tiny thumbnails and like counts. A calendar heatmap shows best posting days. Vibrant magenta-and-purple gradient accents, dark card backgrounds, rounded widgets, glowing highlights, trendy social-analytics dashboard aesthetic.How to use
- Copy the complete original prompt, including any parameters.
- Replace the subject, text and composition with your own requirements.
- Use a compatible external tool; check its current access conditions and review the result.
Before you start
- Check whether a reference image is required. A compatible model label does not mean this example was generated with that model.
- Keep names, figures and visible text accurate; results can vary between model versions.