原文
GPT Image 2 · en
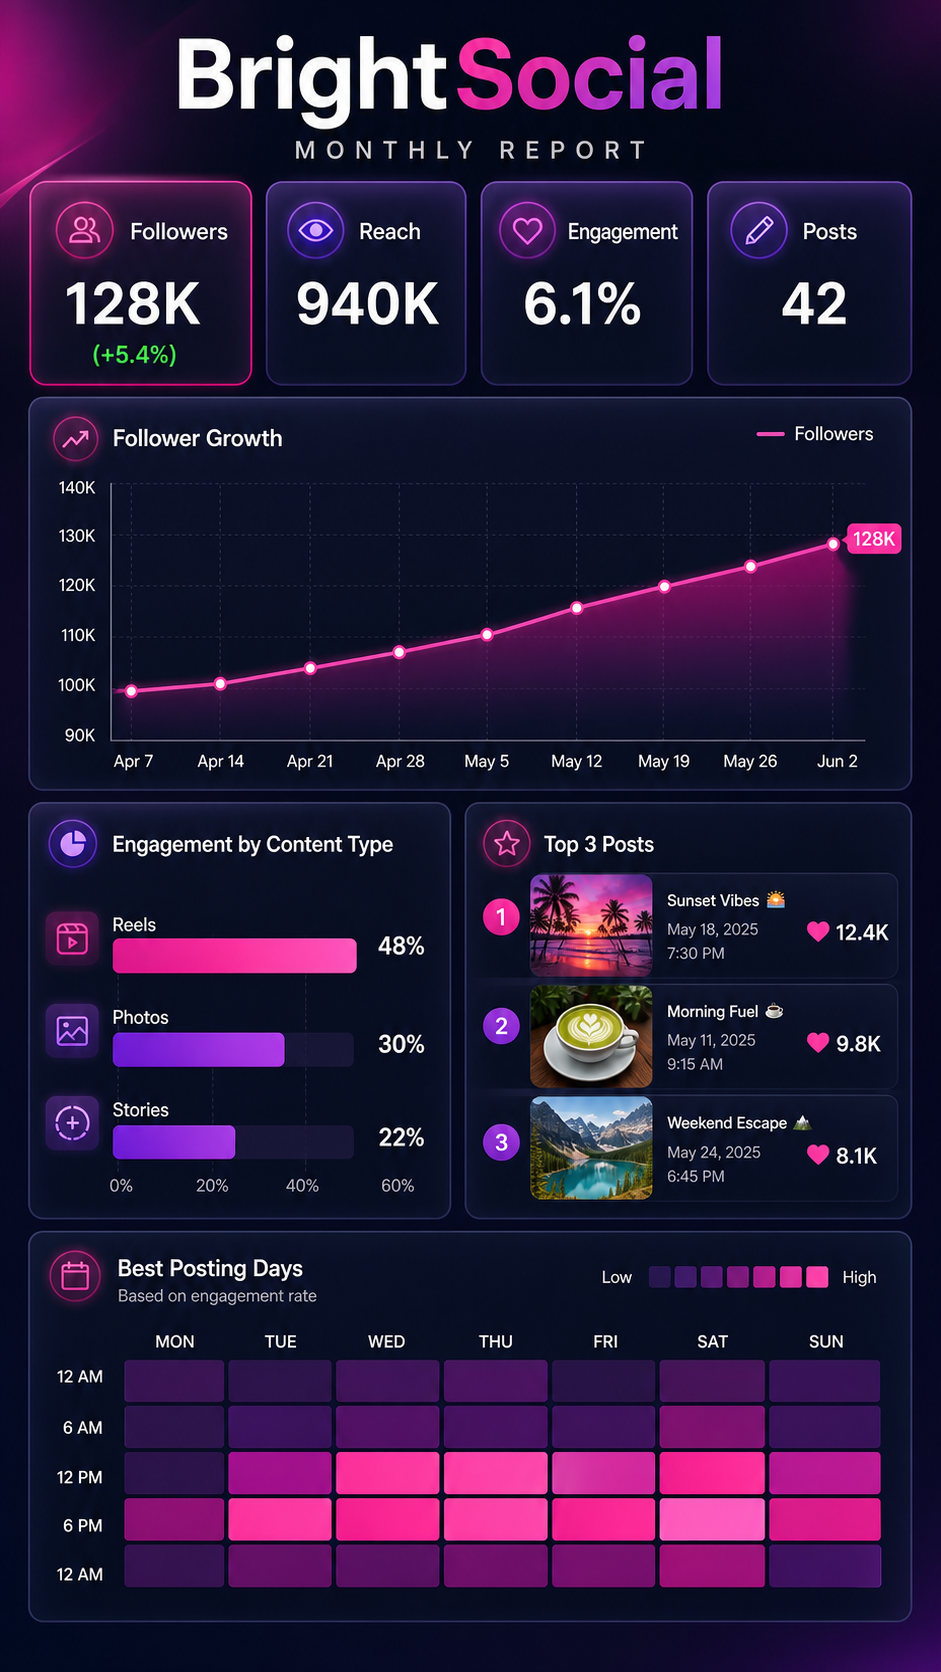
A dashboard infographic, 9:16, titled 'BrightSocial Monthly Report'. A vertical report with a KPI strip: Followers 128K (+5.4%), Reach 940K, Engagement 6.1%, Posts 42. Below, a line chart of follower growth, a horizontal bar of engagement by content type (Reels 48%, Photos 30%, Stories 22%), and a top-3 posts card with tiny thumbnails and like counts. A calendar heatmap shows best posting days. Vibrant magenta-and-purple gradient accents, dark card backgrounds, rounded widgets, glowing highlights, trendy social-analytics dashboard aesthetic.使い方
- パラメータを含む元のプロンプト全体をコピーします。
- 被写体、文字、構図を自分の要件に置き換えます。
- 対応する外部ツールで使用し、利用条件と結果を確認します。
開始前の確認
- 参考画像の要否を確認してください。互換モデルの表示は、そのモデルでの生成実績を意味しません。
- 名前、数値、画像内の文字を確認します。モデルの版で結果は変わります。