原文
GPT Image 2 · en
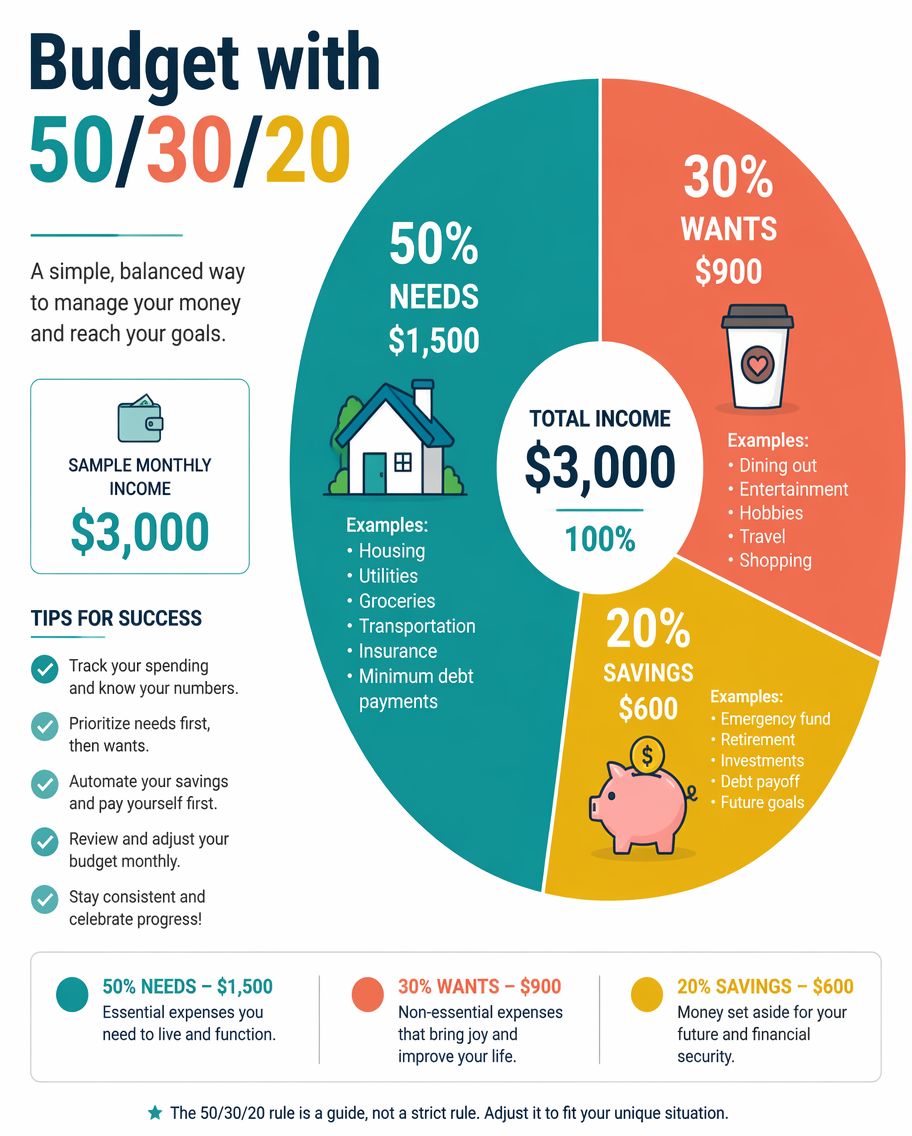
A personal-finance infographic explaining the 50/30/20 budgeting rule as a large donut chart split into three wedges - 50% needs, 30% wants, 20% savings - each labeled with example categories and icons (a house, a coffee cup, a piggy bank). A sample monthly income of $3,000 shows the dollar split beside each slice. Clean modern flat style, a teal, coral and gold palette on white. Bold title 'Budget with 50/30/20' upper-left, a small checklist of tips and a legend along the base.使い方
- パラメータを含む元のプロンプト全体をコピーします。
- 被写体、文字、構図を自分の要件に置き換えます。
- 対応する外部ツールで使用し、利用条件と結果を確認します。
開始前の確認
- 参考画像の要否を確認してください。互換モデルの表示は、そのモデルでの生成実績を意味しません。
- 名前、数値、画像内の文字を確認します。モデルの版で結果は変わります。