原始文档
GPT Image 2 · en
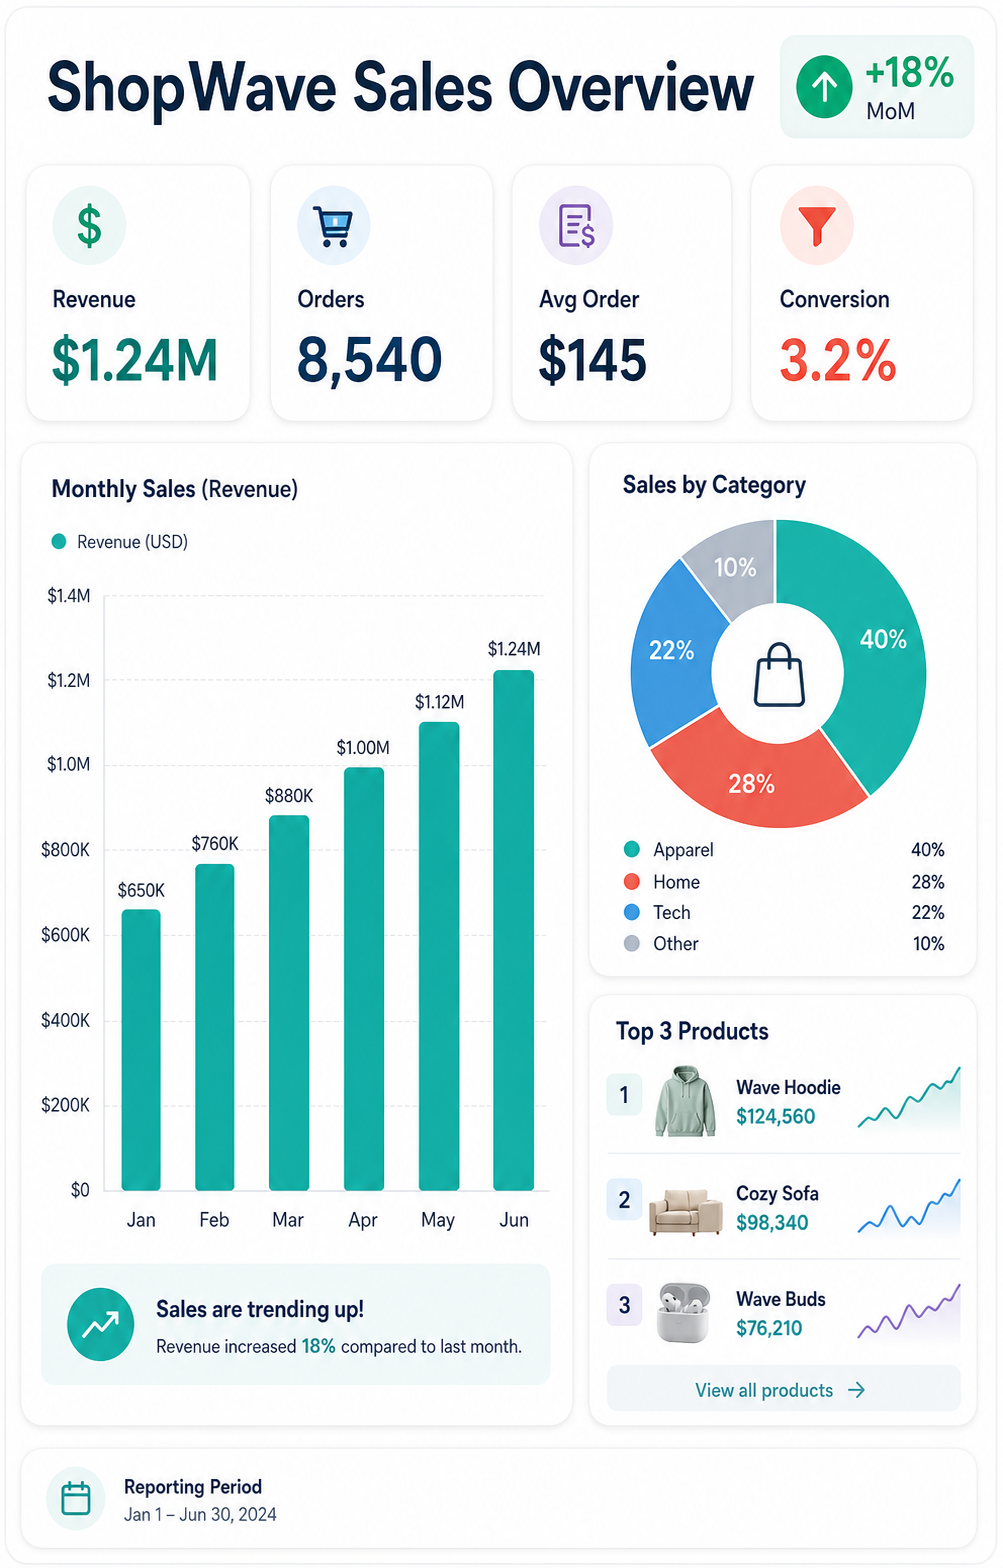
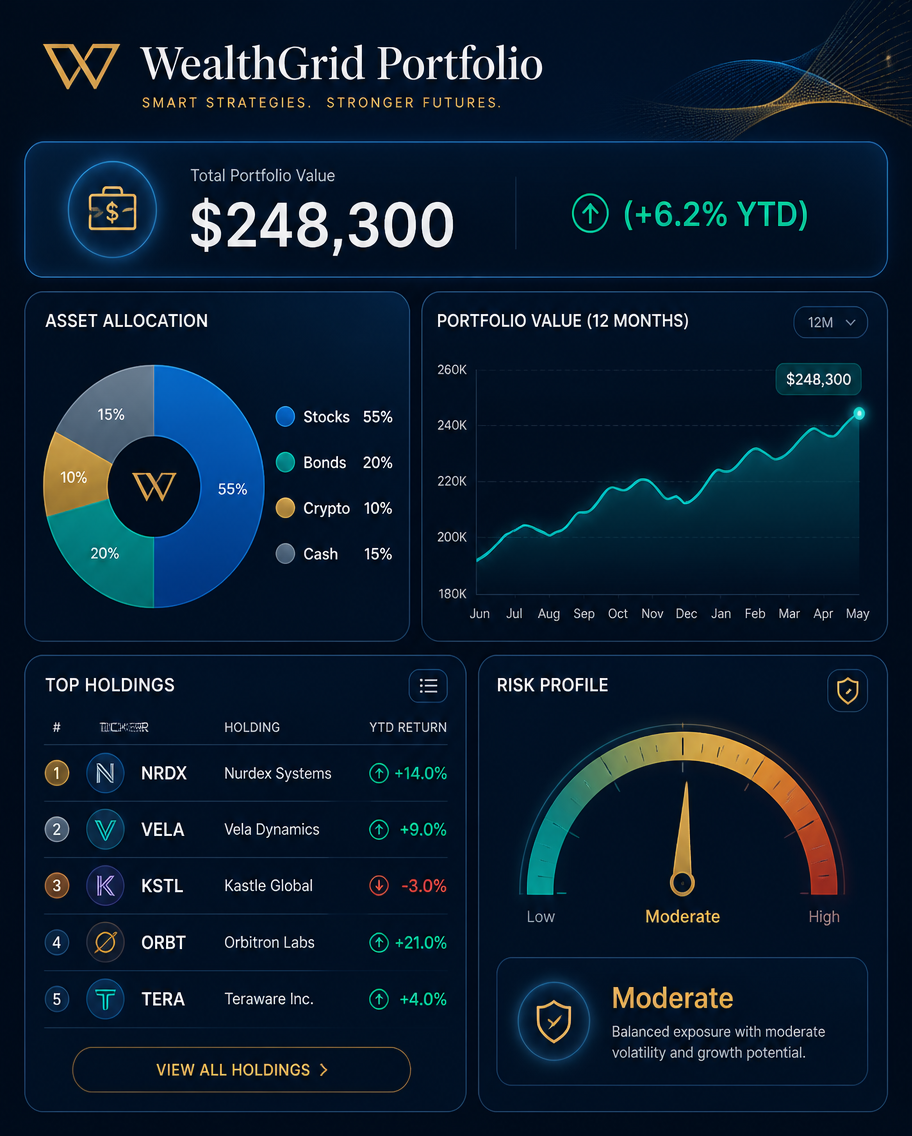
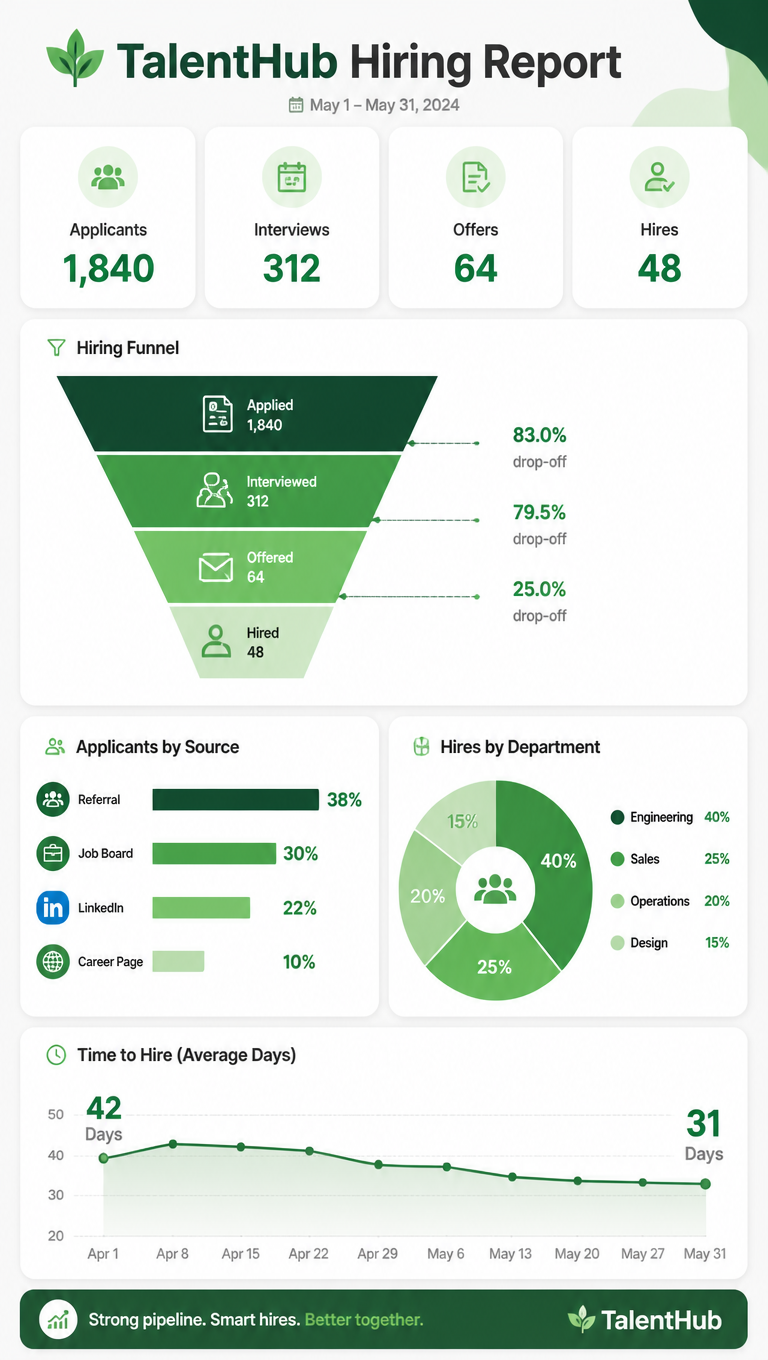
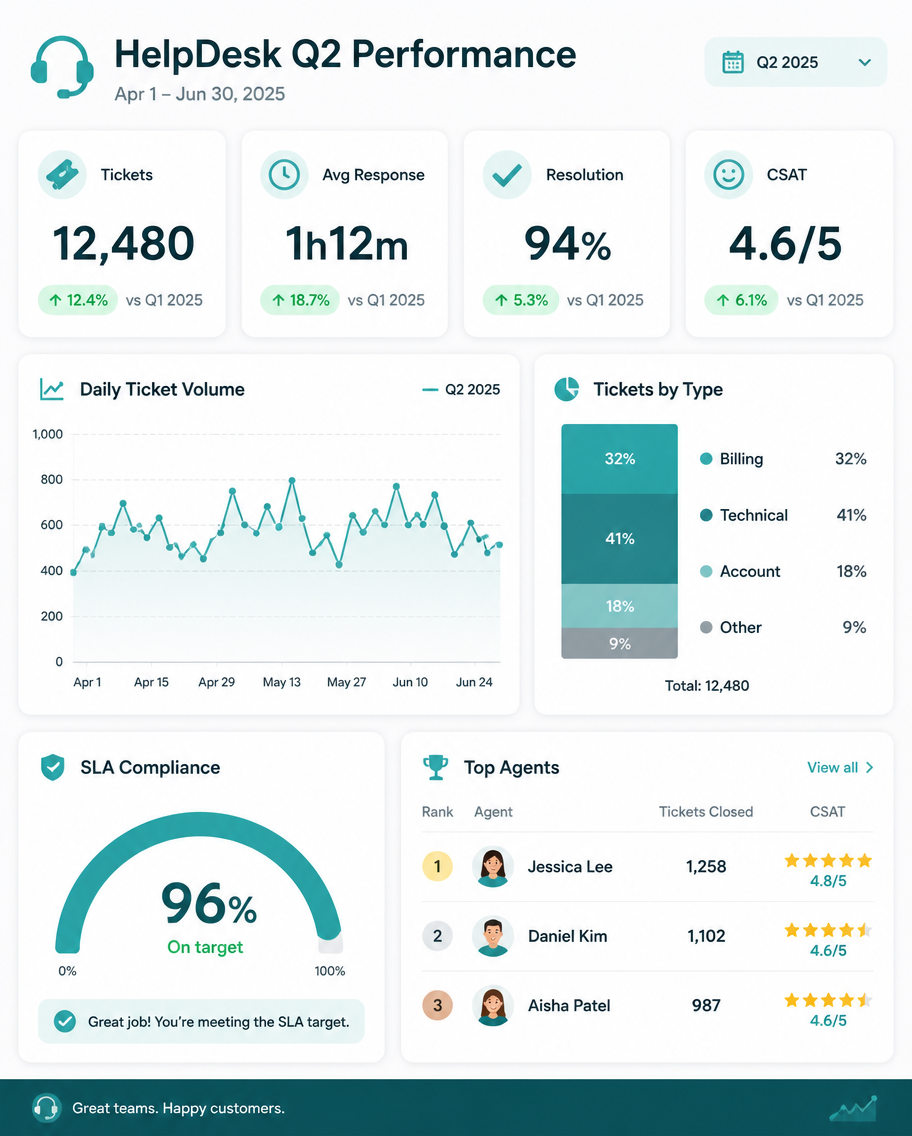
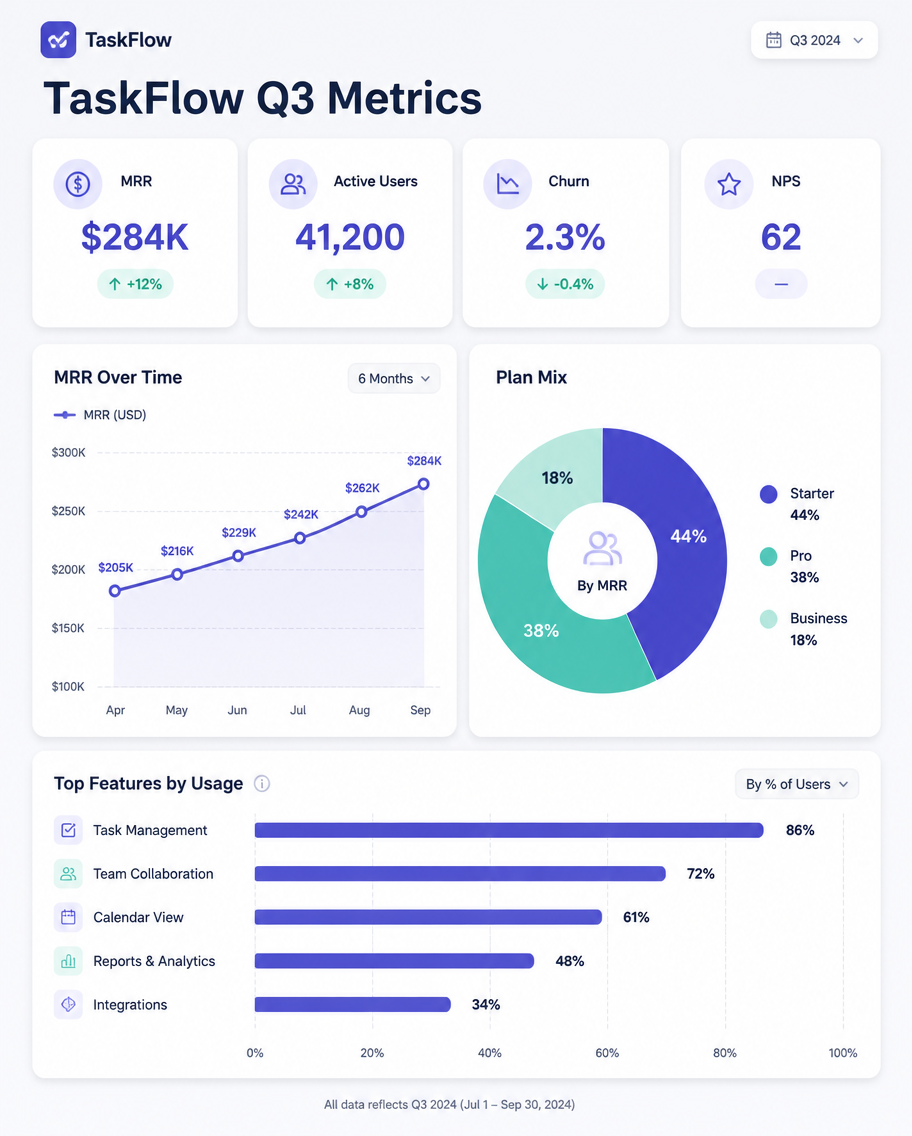
A dashboard-style infographic, 4:5, titled 'TaskFlow Q3 Metrics'. A clean report slide with a top KPI row of four cards: MRR $284K (+12%), Active Users 41,200 (+8%), Churn 2.3% (-0.4%), NPS 62. Below, a two-column layout: left a line chart of revenue climbing over 6 months, right a donut of plan mix (Starter 44%, Pro 38%, Business 18%). A small horizontal bar of top features by usage. Light dashboard-grey background, indigo and mint accents, rounded card widgets, subtle shadows, modern analytics-UI aesthetic, tidy sans-serif.使用方法
- 复制完整原始提示词,并保留其中的参数。
- 按需求替换主体、文字和构图要求。
- 在兼容的外部工具中使用,核对当前使用条件并检查结果。
开始前需了解
- 先确认是否需要参考图。标注兼容模型,不代表该示例由这个模型生成。
- 核对名称、数字与画面文字;不同模型版本的结果可能不同。