Originaldokument
GPT Image 2 · en
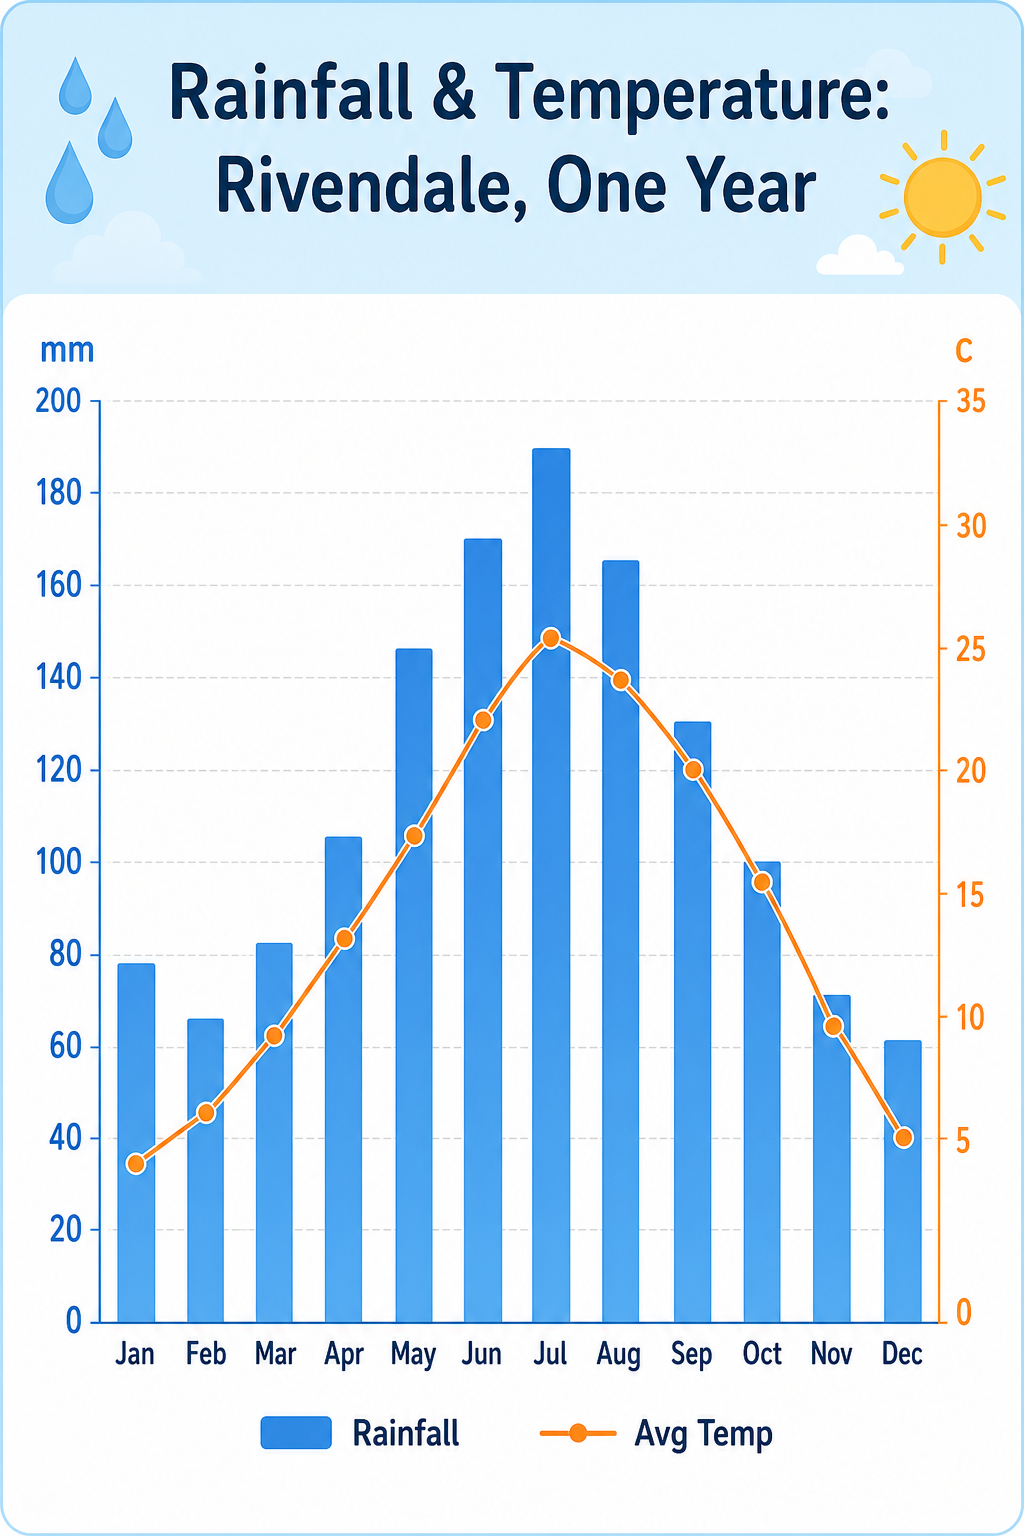
A weather infographic, 4:5, titled 'Rainfall & Temperature: Rivendale, One Year'. A combo chart: twelve blue bars for monthly rainfall (mm) peaking at 190 in July, plus an overlaid orange line for average temperature curving from 4C in January to 26C in July. Dual axes (mm left, C right), month abbreviations along the base, faint grid. A small legend distinguishes 'Rainfall' and 'Avg Temp'. Pale sky-blue header band, clean white plot, rounded sans-serif, tidy educational layout with a raindrop and sun motif in corners.Verwendung
- Den vollständigen Original-Prompt einschließlich Parametern kopieren.
- Motiv, Text und Komposition an die eigenen Anforderungen anpassen.
- Ein kompatibles externes Werkzeug nutzen; Zugangsbedingungen und Ergebnis prüfen.
Vor dem Start
- Prüfen, ob ein Referenzbild nötig ist. Kompatibilität belegt nicht das tatsächlich verwendete Modell.
- Namen, Zahlen und Bildtexte prüfen; Modellversionen können andere Ergebnisse liefern.