原始文档
GPT Image 2 · en
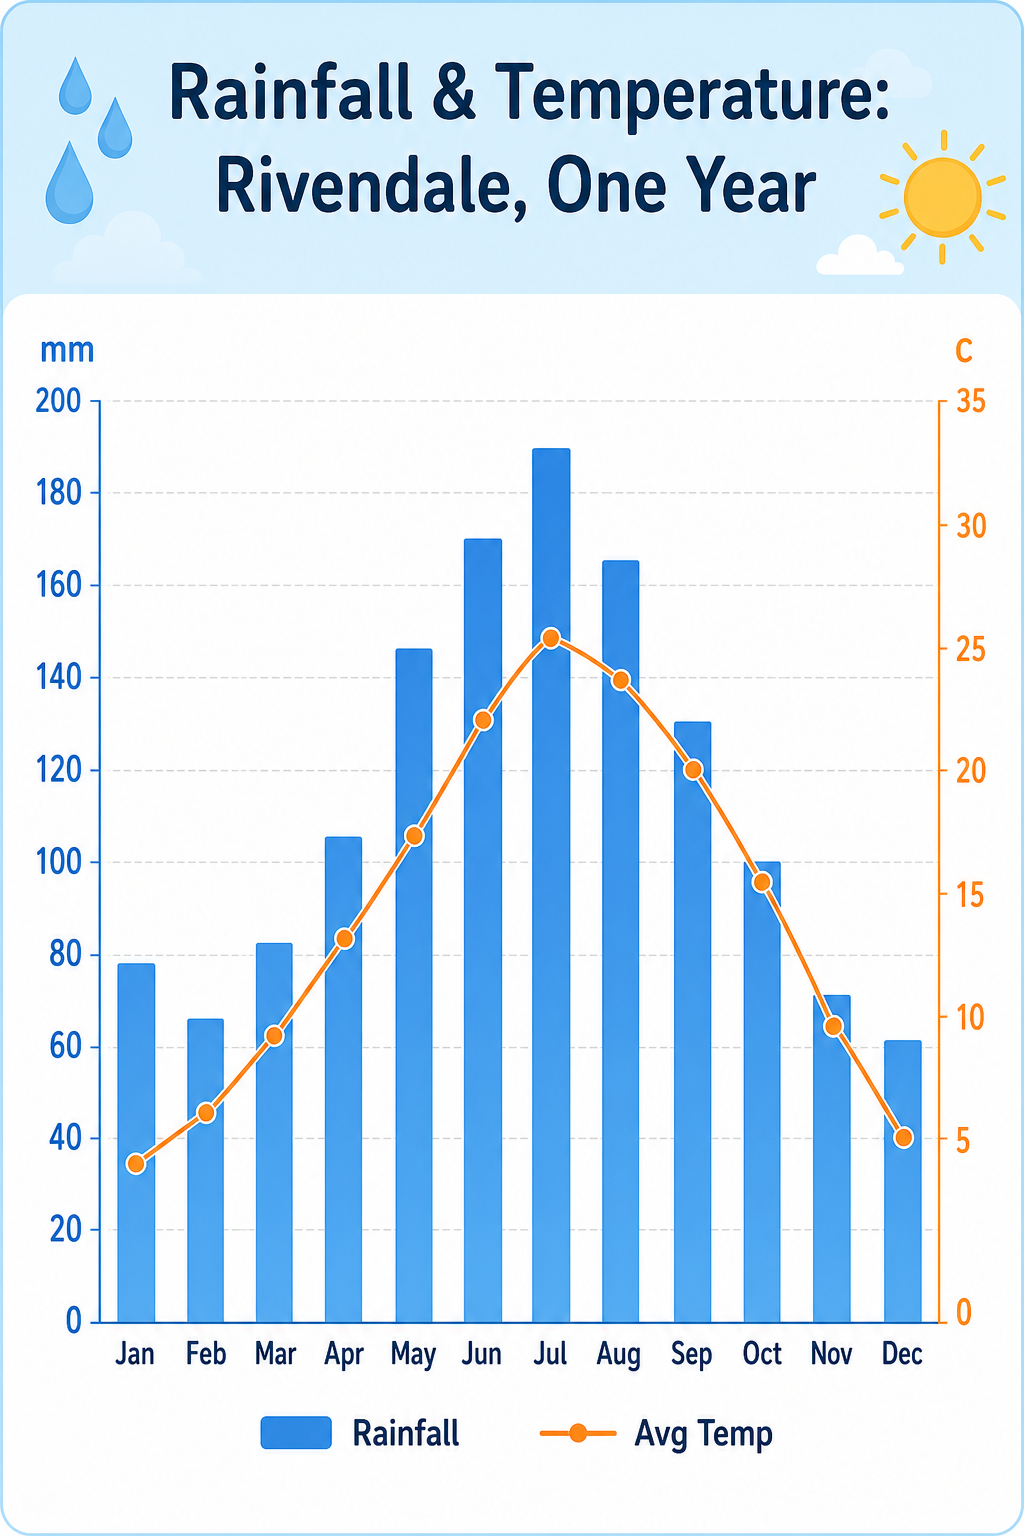
A weather infographic, 4:5, titled 'Rainfall & Temperature: Rivendale, One Year'. A combo chart: twelve blue bars for monthly rainfall (mm) peaking at 190 in July, plus an overlaid orange line for average temperature curving from 4C in January to 26C in July. Dual axes (mm left, C right), month abbreviations along the base, faint grid. A small legend distinguishes 'Rainfall' and 'Avg Temp'. Pale sky-blue header band, clean white plot, rounded sans-serif, tidy educational layout with a raindrop and sun motif in corners.使用方法
- 复制完整原始提示词,并保留其中的参数。
- 按需求替换主体、文字和构图要求。
- 在兼容的外部工具中使用,核对当前使用条件并检查结果。
开始前需了解
- 先确认是否需要参考图。标注兼容模型,不代表该示例由这个模型生成。
- 核对名称、数字与画面文字;不同模型版本的结果可能不同。