Documento originale
GPT Image 2 · en
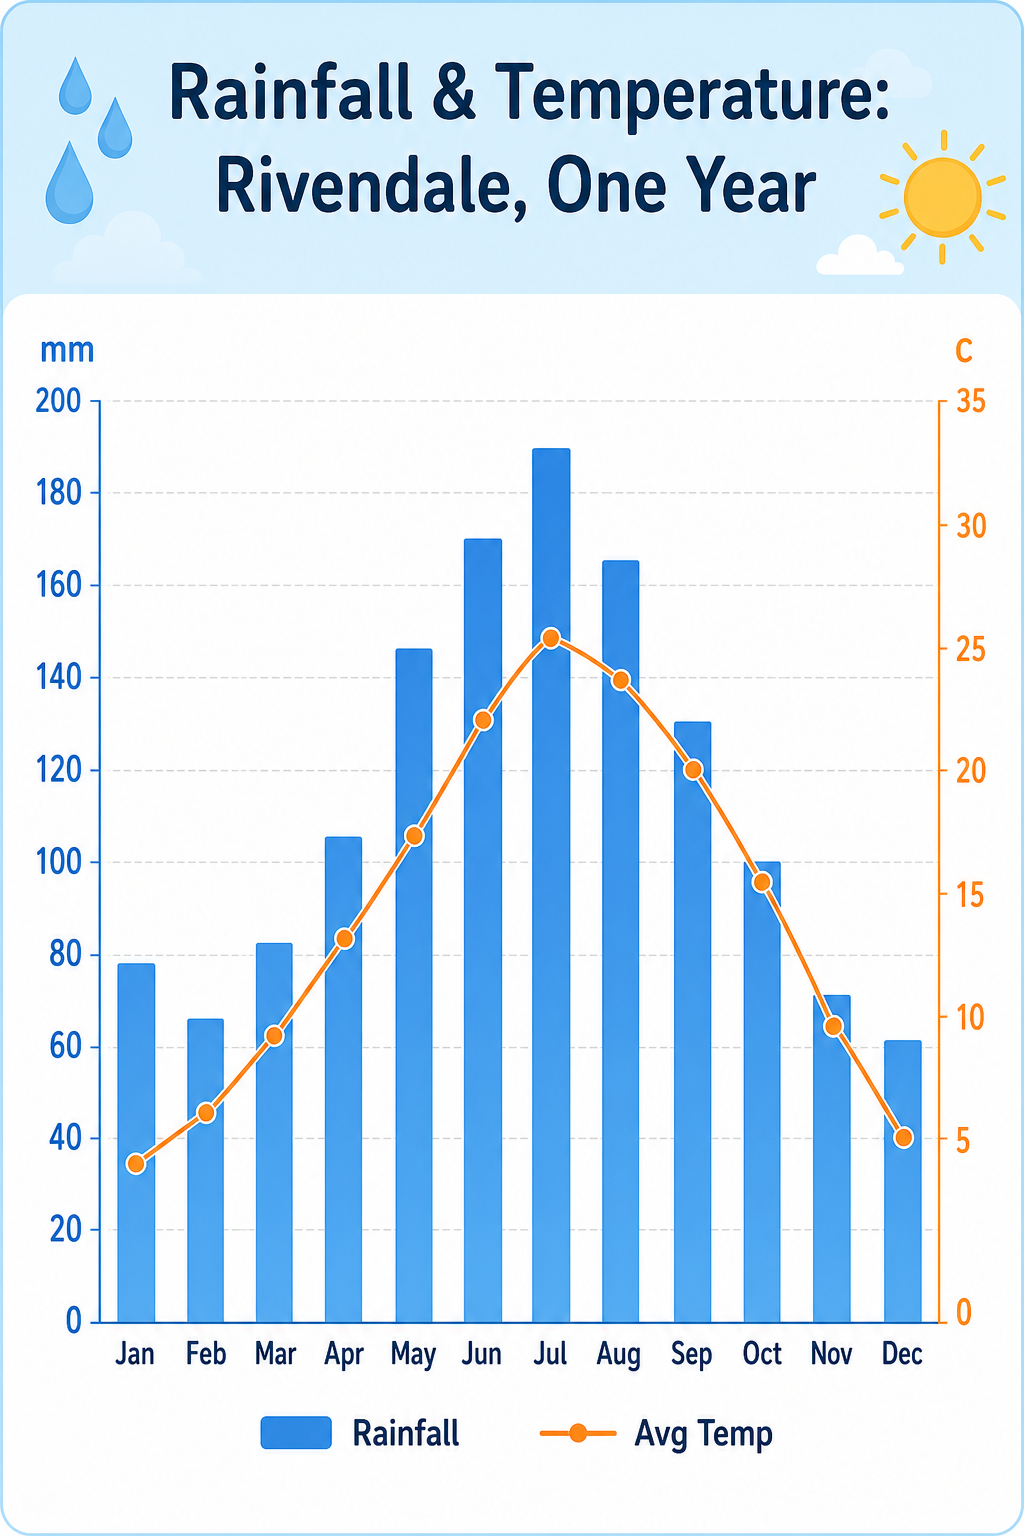
A weather infographic, 4:5, titled 'Rainfall & Temperature: Rivendale, One Year'. A combo chart: twelve blue bars for monthly rainfall (mm) peaking at 190 in July, plus an overlaid orange line for average temperature curving from 4C in January to 26C in July. Dual axes (mm left, C right), month abbreviations along the base, faint grid. A small legend distinguishes 'Rainfall' and 'Avg Temp'. Pale sky-blue header band, clean white plot, rounded sans-serif, tidy educational layout with a raindrop and sun motif in corners.Come usare
- Copia tutto il prompt originale, inclusi i parametri.
- Adatta soggetto, testo e composizione alle tue esigenze.
- Usa uno strumento esterno compatibile; verifica accesso e risultato.
Prima di iniziare
- Controlla se serve un’immagine di riferimento. La compatibilità non prova il modello usato per l’esempio.
- Verifica nomi, numeri e testi; i risultati cambiano con le versioni del modello.