Oryginalny dokument
GPT Image 2 · en
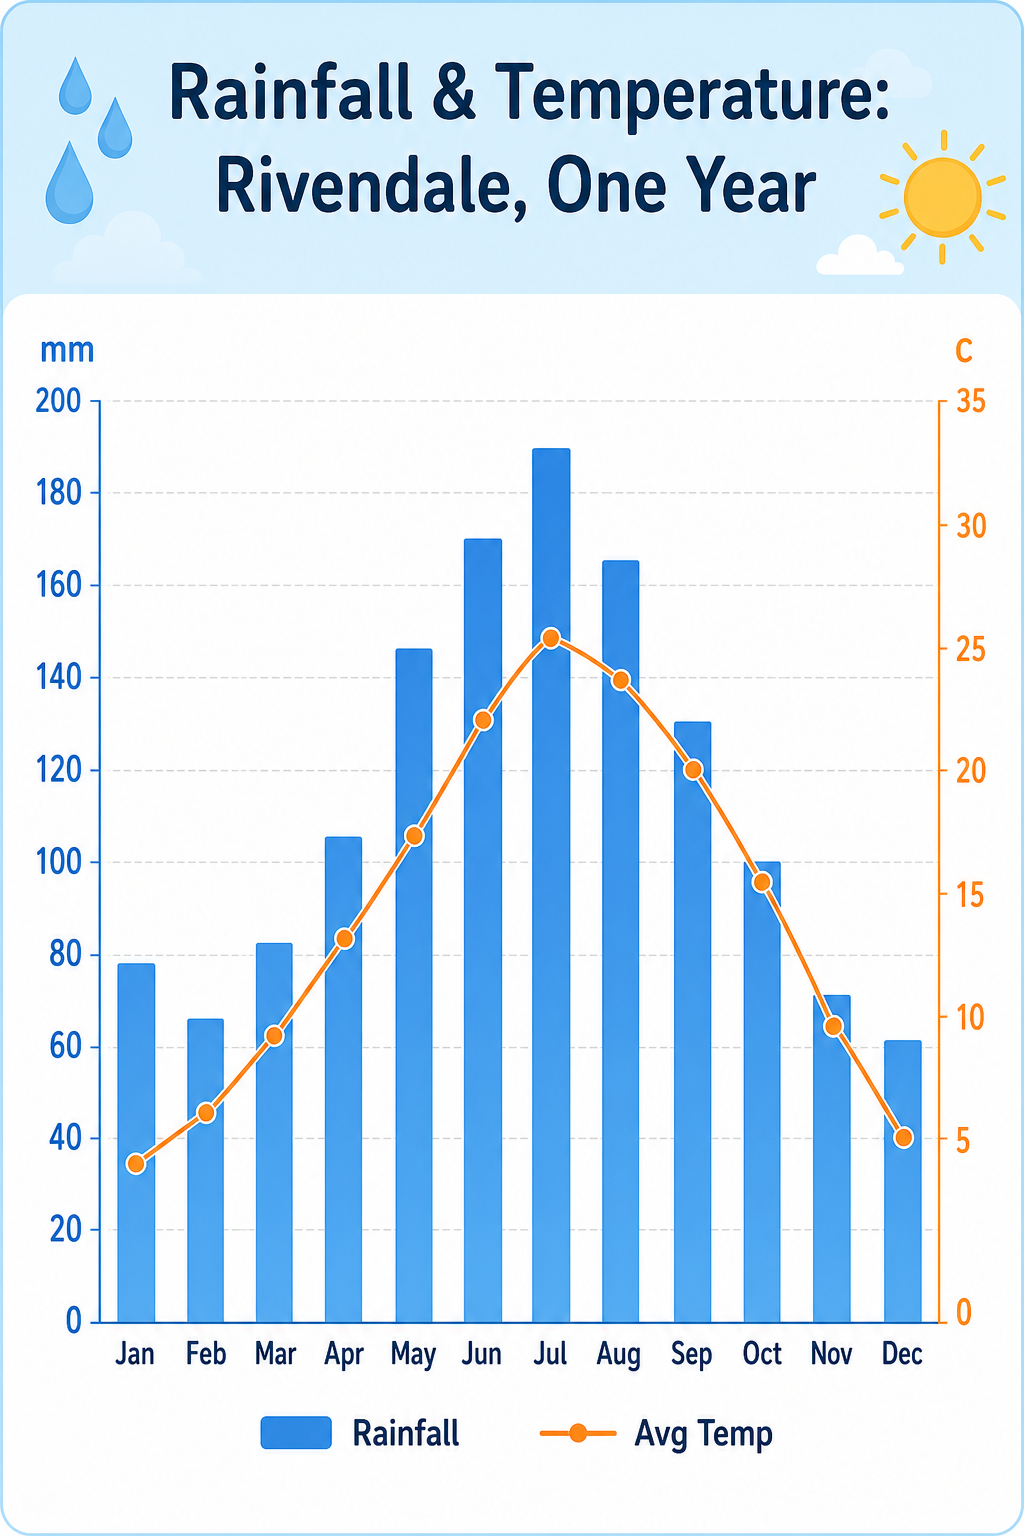
A weather infographic, 4:5, titled 'Rainfall & Temperature: Rivendale, One Year'. A combo chart: twelve blue bars for monthly rainfall (mm) peaking at 190 in July, plus an overlaid orange line for average temperature curving from 4C in January to 26C in July. Dual axes (mm left, C right), month abbreviations along the base, faint grid. A small legend distinguishes 'Rainfall' and 'Avg Temp'. Pale sky-blue header band, clean white plot, rounded sans-serif, tidy educational layout with a raindrop and sun motif in corners.Jak używać
- Skopiuj cały oryginalny prompt wraz z parametrami.
- Dostosuj temat, tekst i kompozycję do swoich potrzeb.
- Użyj zgodnego narzędzia zewnętrznego; sprawdź warunki dostępu i wynik.
Przed rozpoczęciem
- Sprawdź, czy potrzebny jest obraz referencyjny. Zgodność nie potwierdza modelu użytego do przykładu.
- Sprawdź nazwy, liczby i napisy; wyniki zależą od wersji modelu.