Original document
GPT Image 2 · en
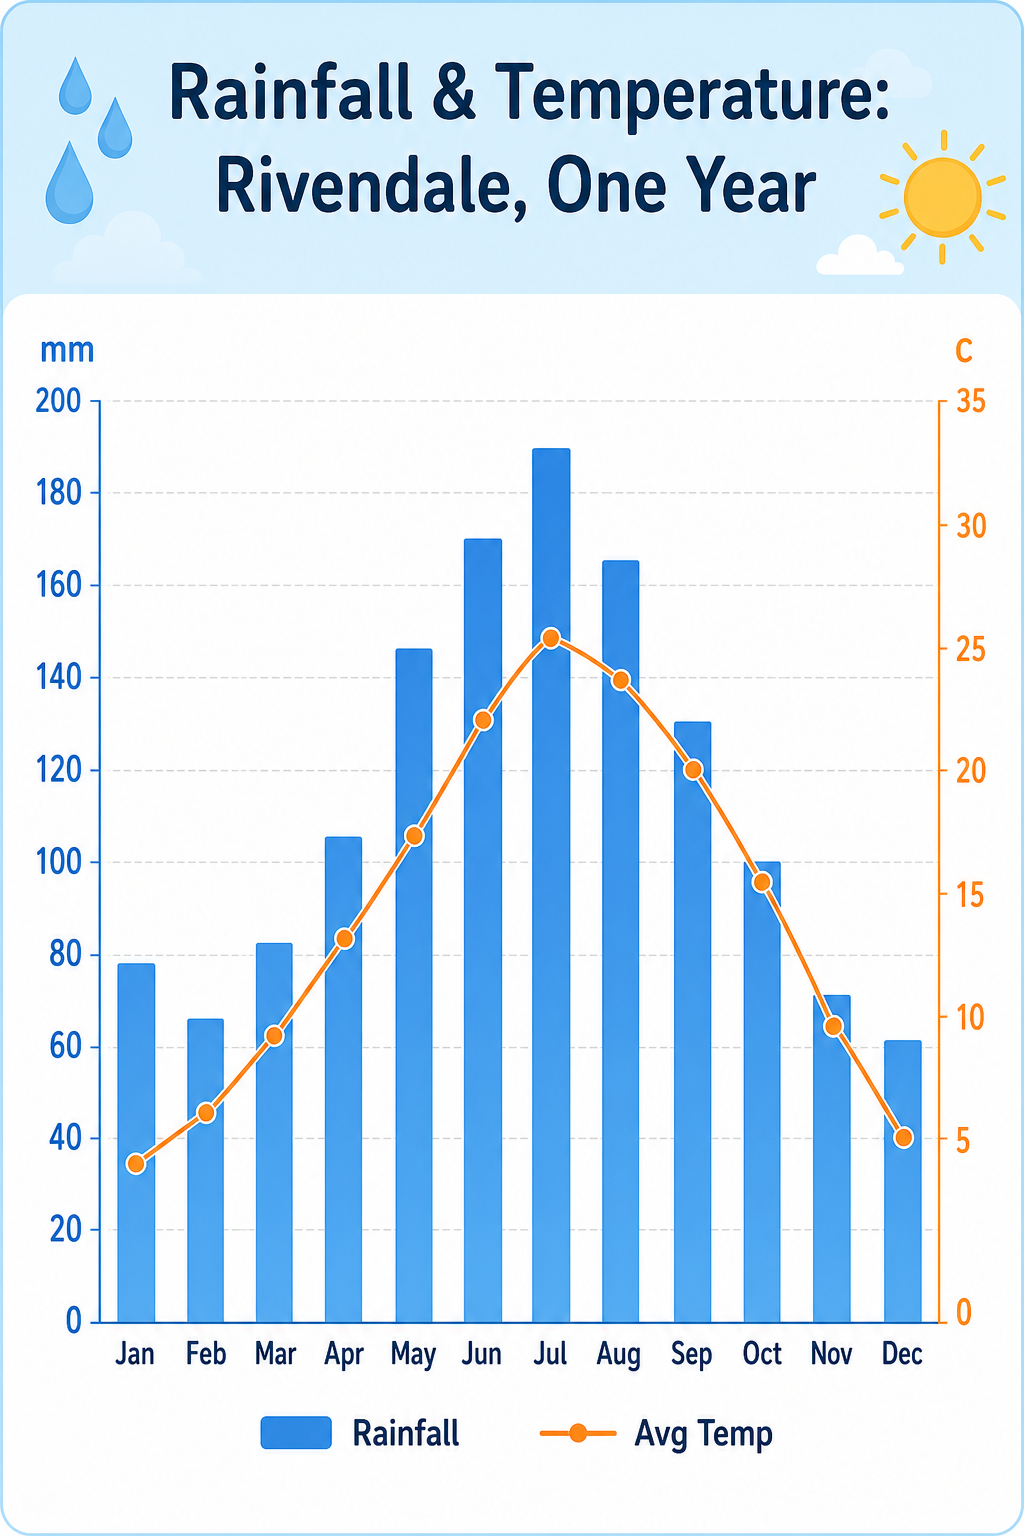
A weather infographic, 4:5, titled 'Rainfall & Temperature: Rivendale, One Year'. A combo chart: twelve blue bars for monthly rainfall (mm) peaking at 190 in July, plus an overlaid orange line for average temperature curving from 4C in January to 26C in July. Dual axes (mm left, C right), month abbreviations along the base, faint grid. A small legend distinguishes 'Rainfall' and 'Avg Temp'. Pale sky-blue header band, clean white plot, rounded sans-serif, tidy educational layout with a raindrop and sun motif in corners.How to use
- Copy the complete original prompt, including any parameters.
- Replace the subject, text and composition with your own requirements.
- Use a compatible external tool; check its current access conditions and review the result.
Before you start
- Check whether a reference image is required. A compatible model label does not mean this example was generated with that model.
- Keep names, figures and visible text accurate; results can vary between model versions.