Originaldokument
GPT Image 2 · en
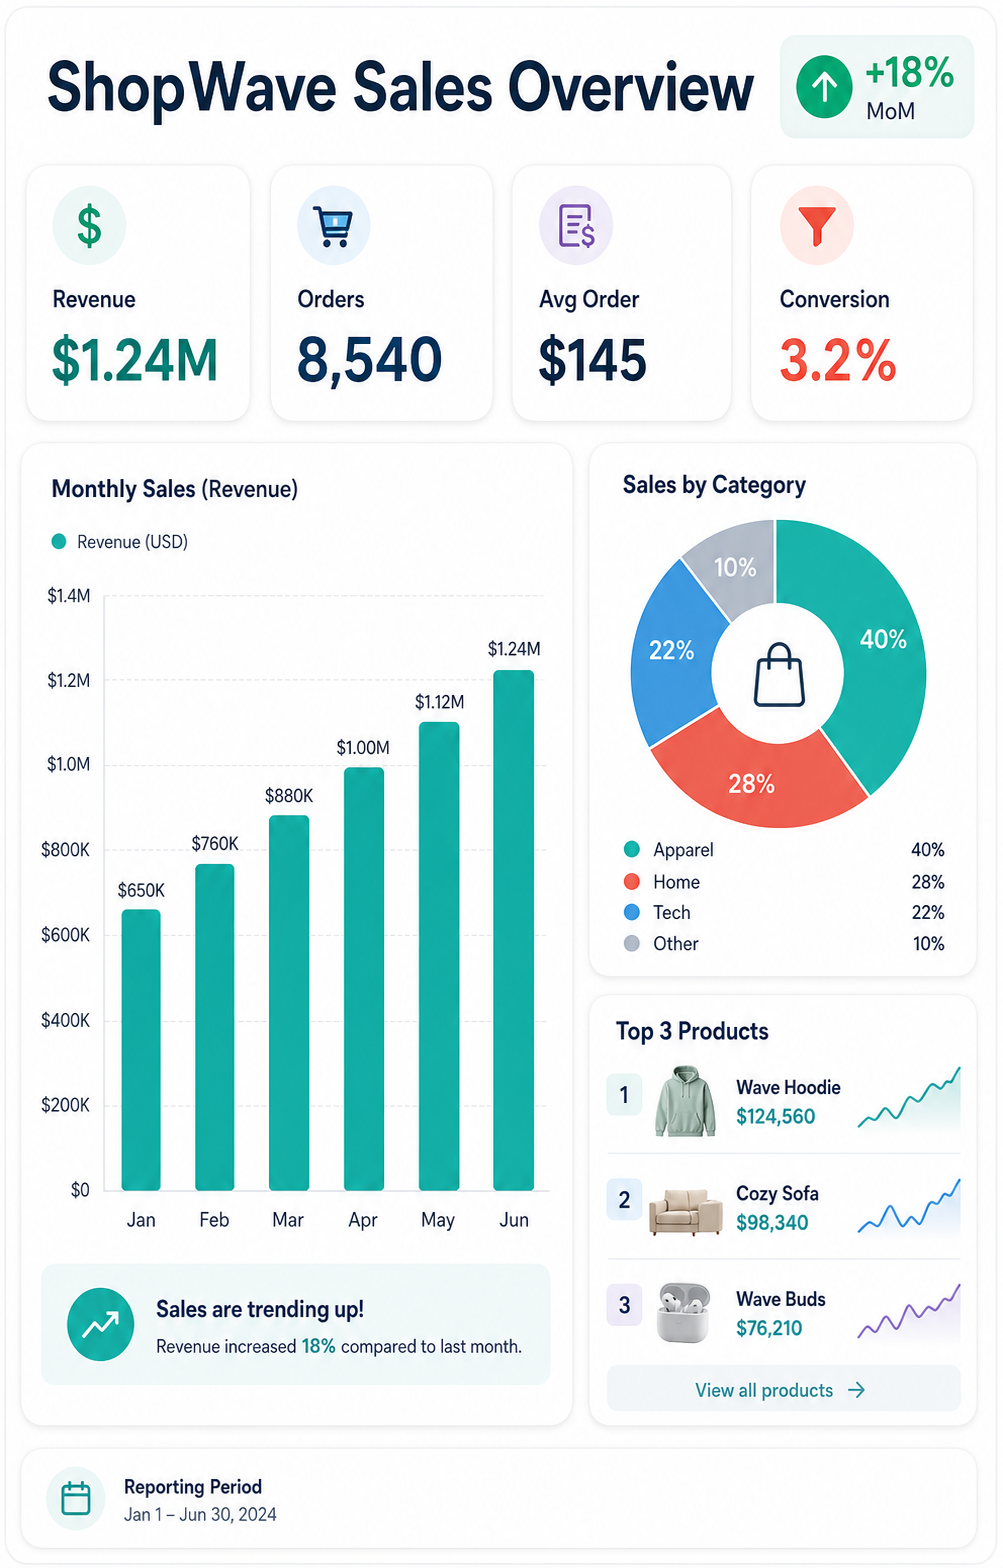
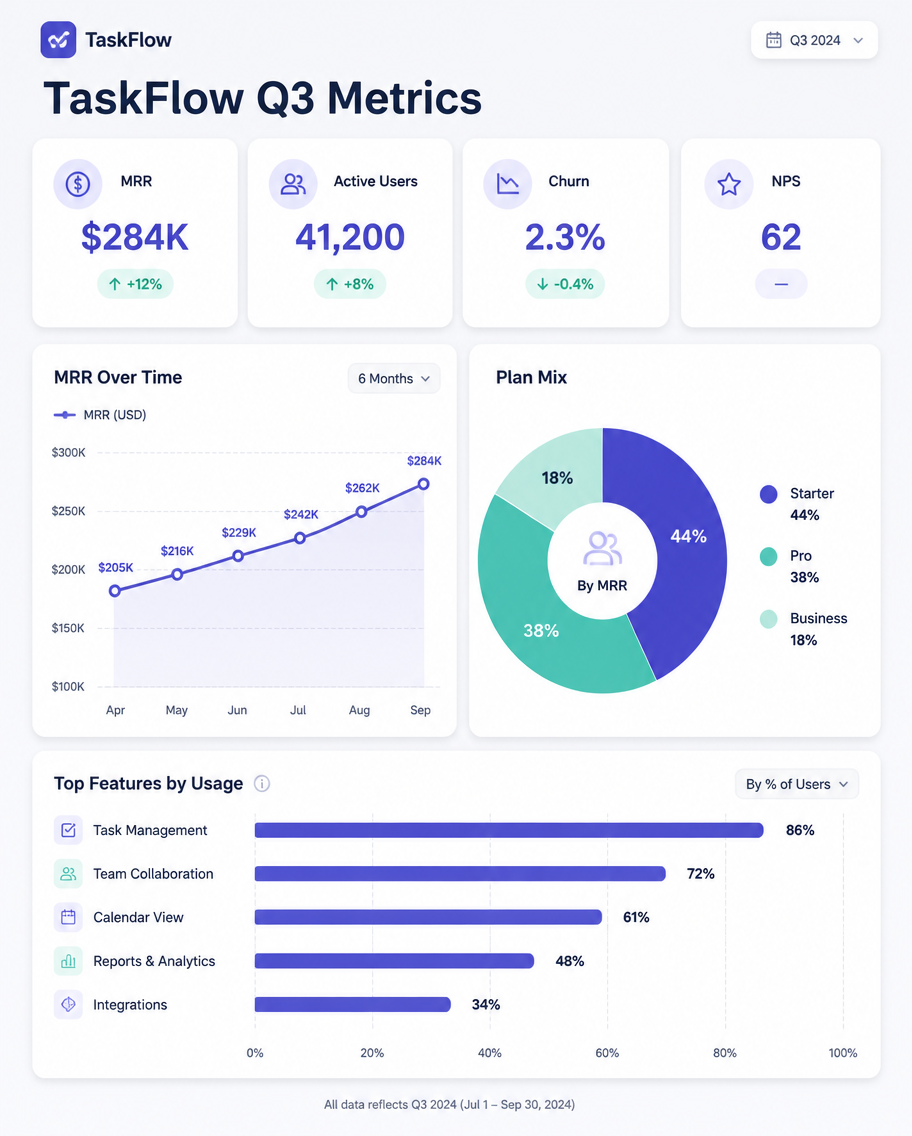
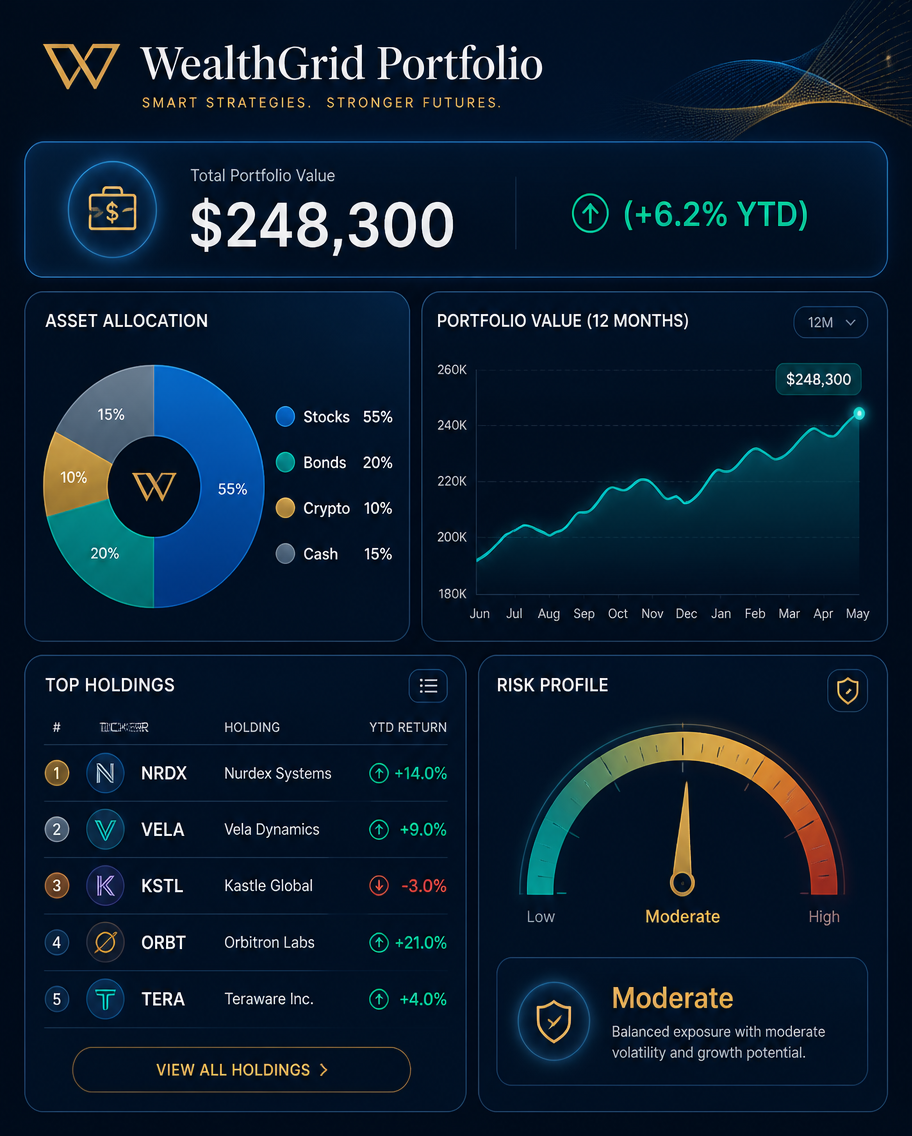
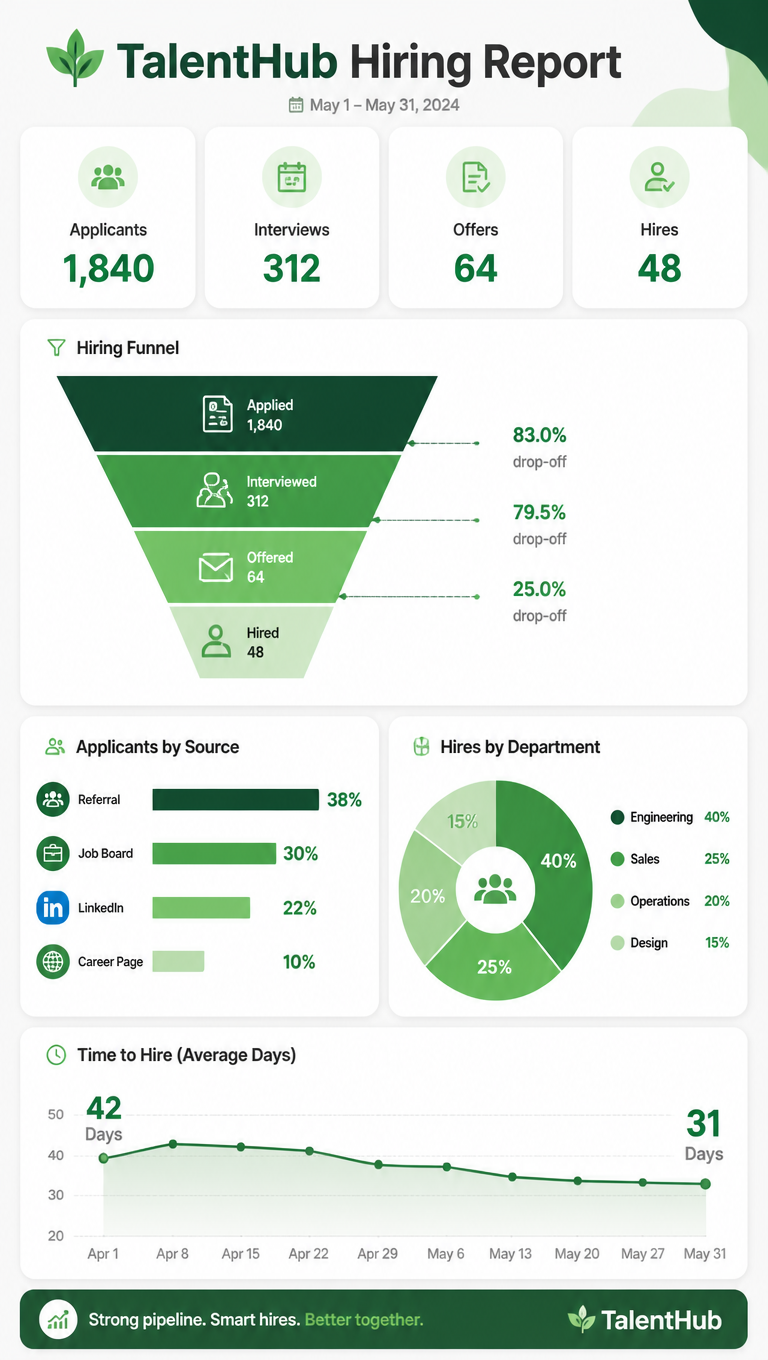
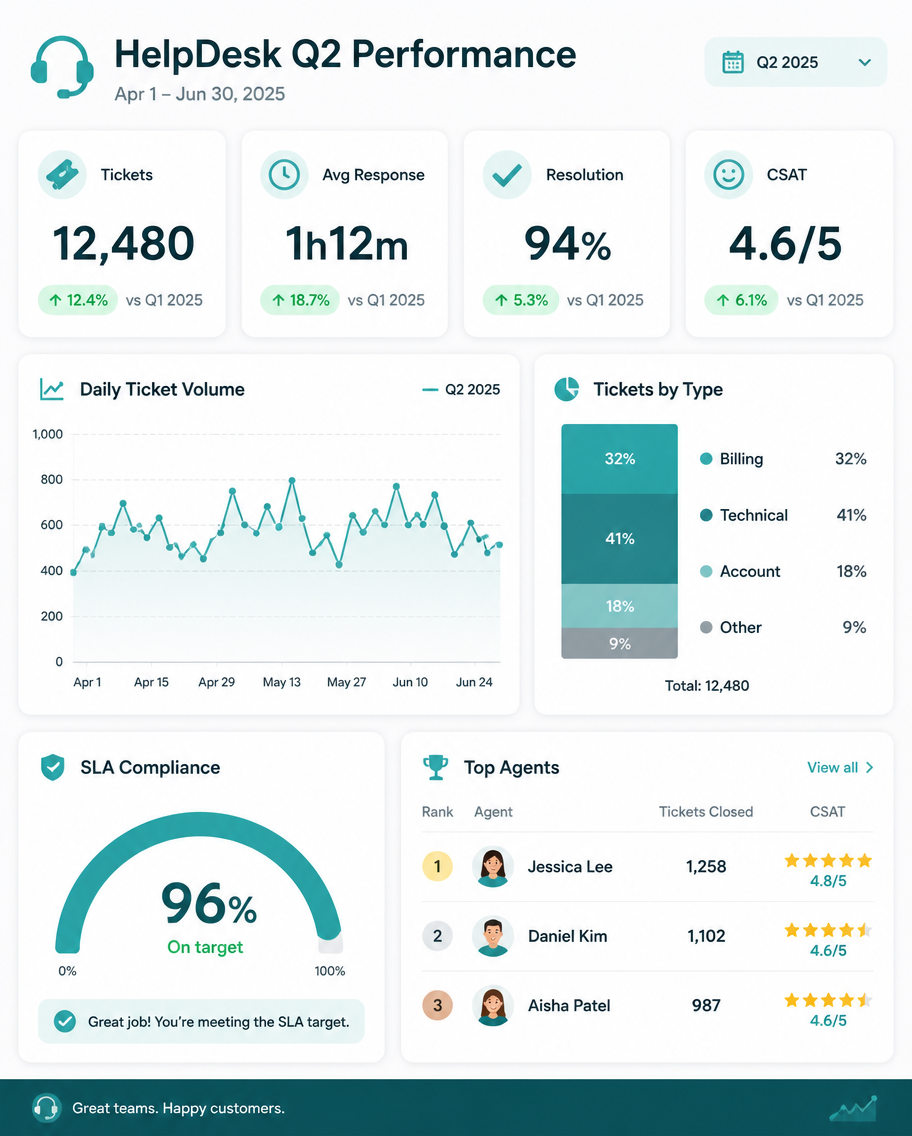
A dashboard infographic, 4:5, titled 'HelpDesk Q2 Performance'. A report slide with four KPI cards: Tickets 12,480, Avg Response 1h12m, Resolution 94%, CSAT 4.6/5. A line chart tracks daily ticket volume, a stacked bar splits ticket type (Billing 32%, Technical 41%, Account 18%, Other 9%), and a gauge shows SLA compliance at 96%. A small agent-leaderboard card lists three top performers with star ratings. Calm teal-and-white palette, rounded widgets on a light grid, green trend badges, tidy professional support-dashboard aesthetic.Verwendung
- Den vollständigen Original-Prompt einschließlich Parametern kopieren.
- Motiv, Text und Komposition an die eigenen Anforderungen anpassen.
- Ein kompatibles externes Werkzeug nutzen; Zugangsbedingungen und Ergebnis prüfen.
Vor dem Start
- Prüfen, ob ein Referenzbild nötig ist. Kompatibilität belegt nicht das tatsächlich verwendete Modell.
- Namen, Zahlen und Bildtexte prüfen; Modellversionen können andere Ergebnisse liefern.