원본 문서
GPT Image 2 · en
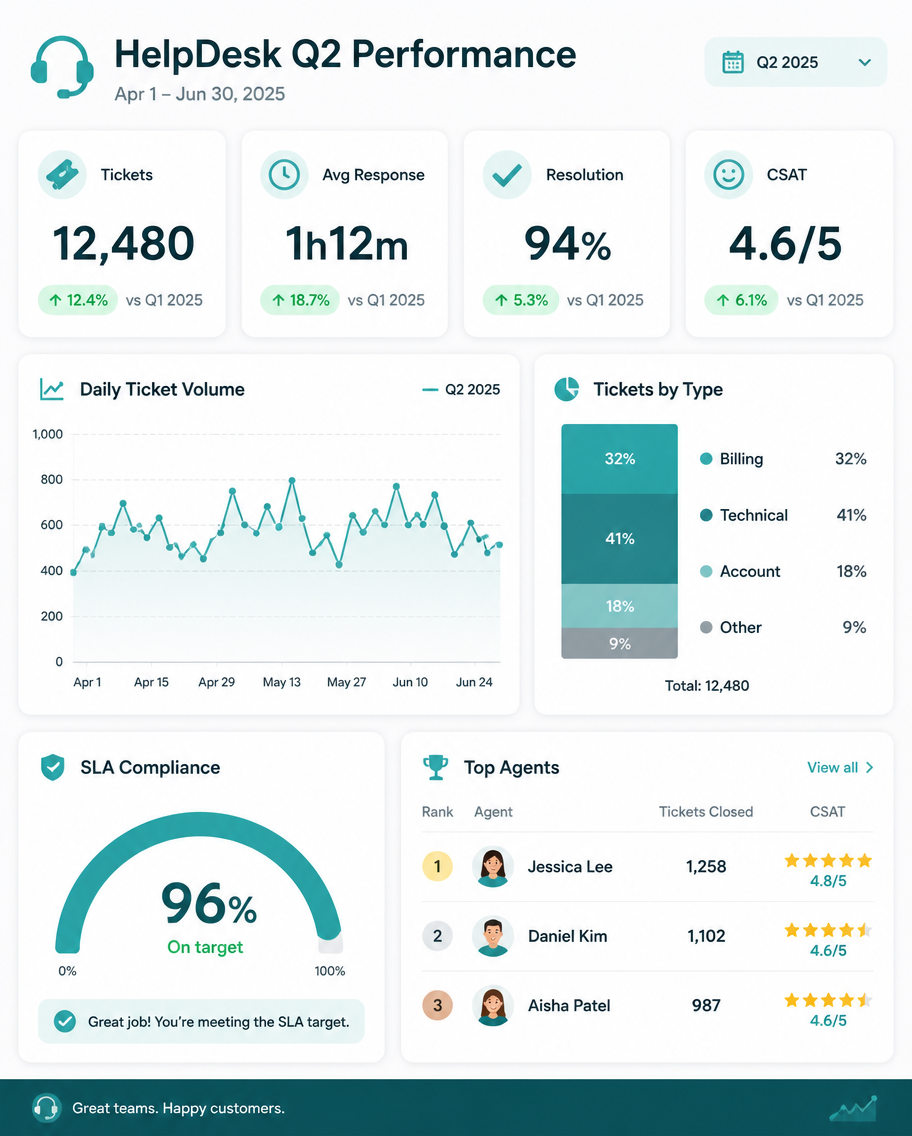
A dashboard infographic, 4:5, titled 'HelpDesk Q2 Performance'. A report slide with four KPI cards: Tickets 12,480, Avg Response 1h12m, Resolution 94%, CSAT 4.6/5. A line chart tracks daily ticket volume, a stacked bar splits ticket type (Billing 32%, Technical 41%, Account 18%, Other 9%), and a gauge shows SLA compliance at 96%. A small agent-leaderboard card lists three top performers with star ratings. Calm teal-and-white palette, rounded widgets on a light grid, green trend badges, tidy professional support-dashboard aesthetic.사용 방법
- 매개변수를 포함한 전체 원본 프롬프트를 복사하세요.
- 주제, 문구, 구도를 자신의 요구에 맞게 바꾸세요.
- 호환되는 외부 도구에서 사용하고 이용 조건과 결과를 확인하세요.
시작 전 확인
- 참조 이미지가 필요한지 확인하세요. 호환 표시는 해당 모델로 이 예시를 생성했다는 뜻이 아닙니다.
- 이름, 수치, 이미지 속 문구를 확인하세요. 모델 버전에 따라 결과가 다를 수 있습니다.