Original document
GPT Image 2 · en
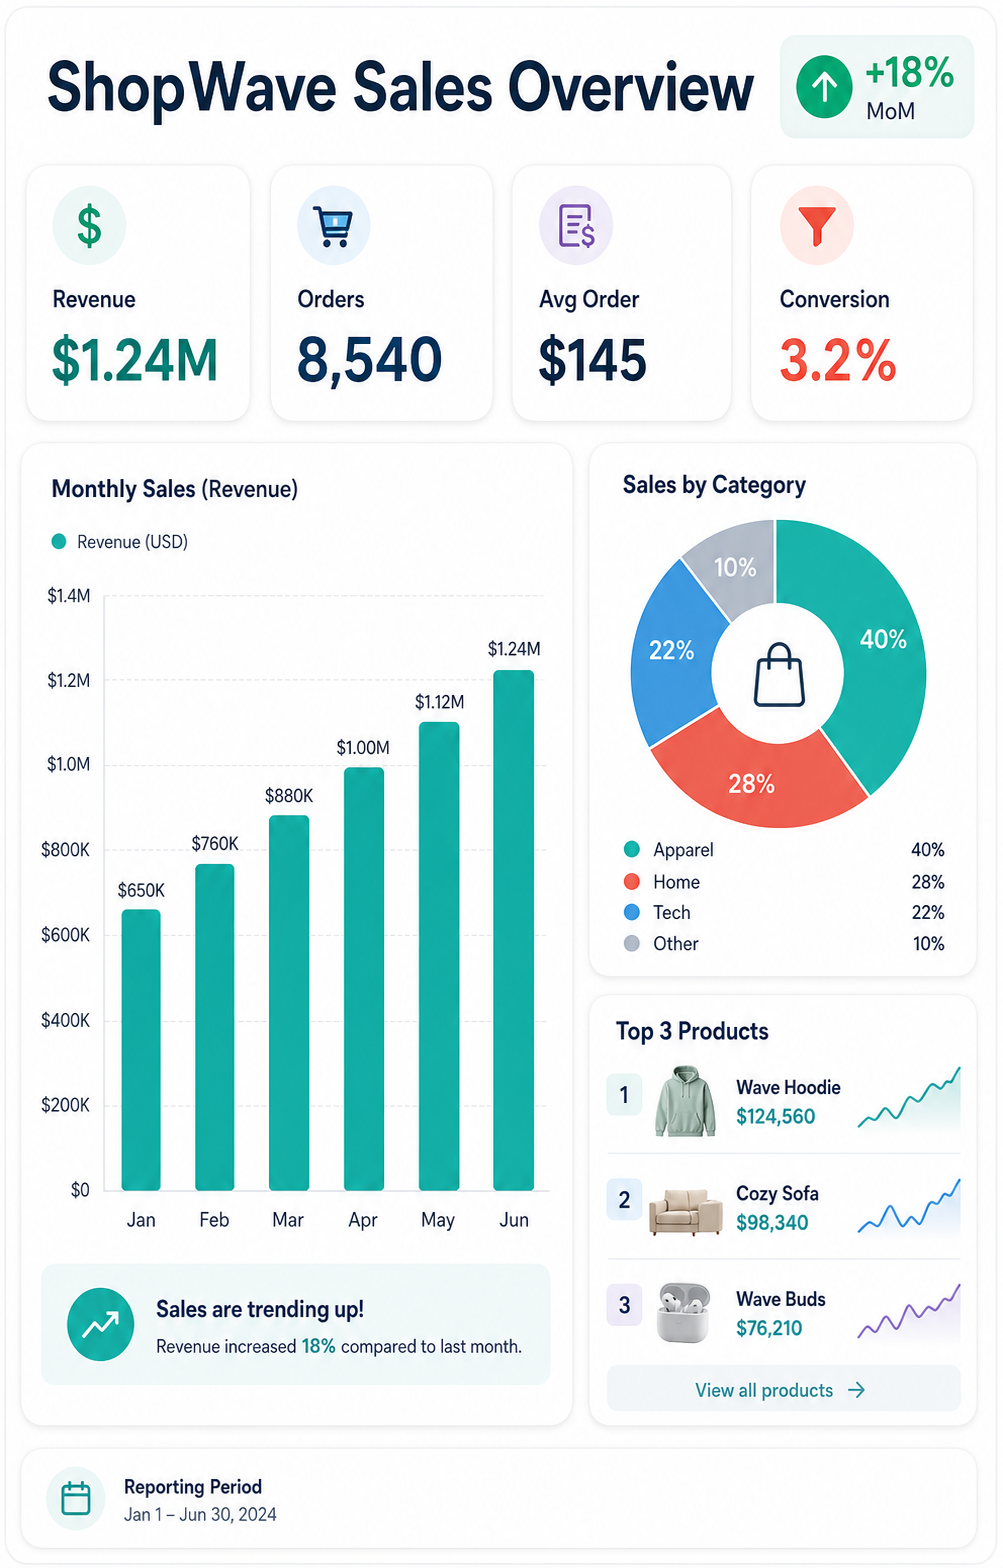
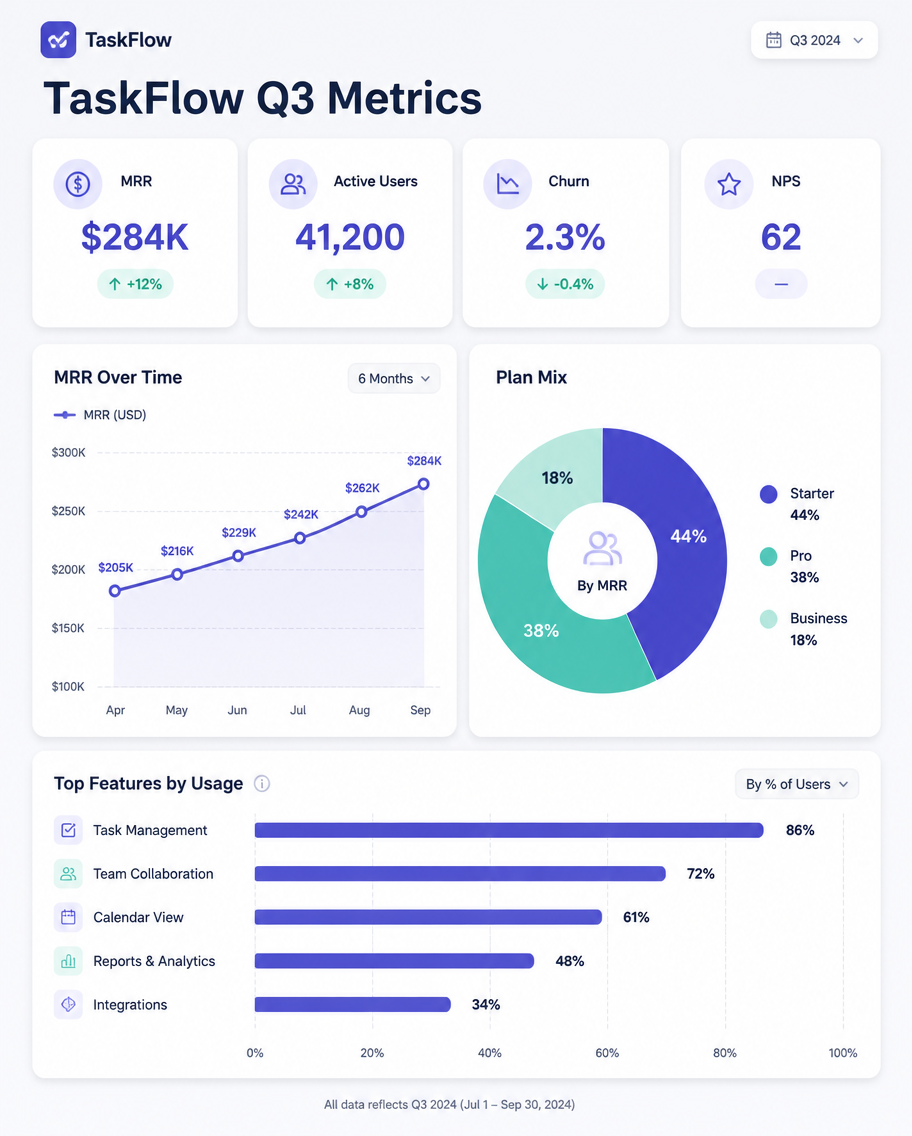
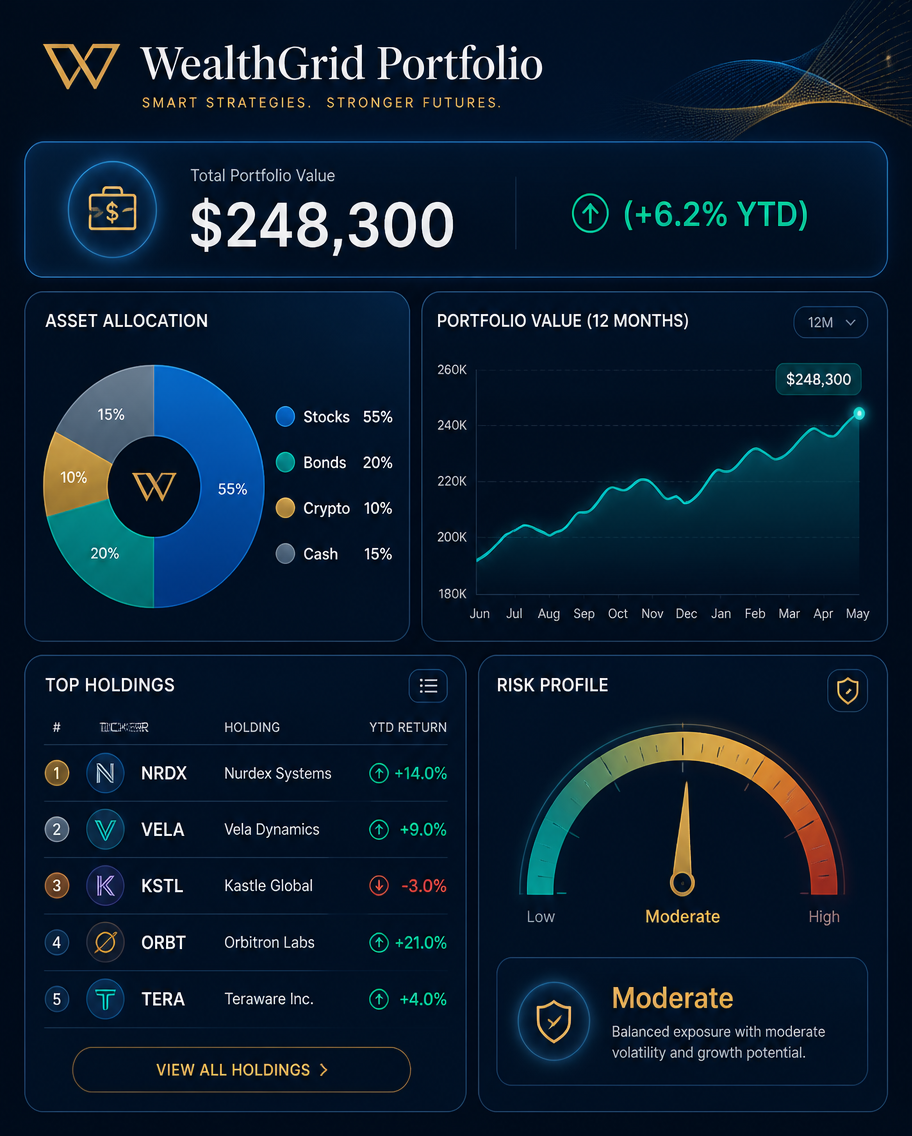
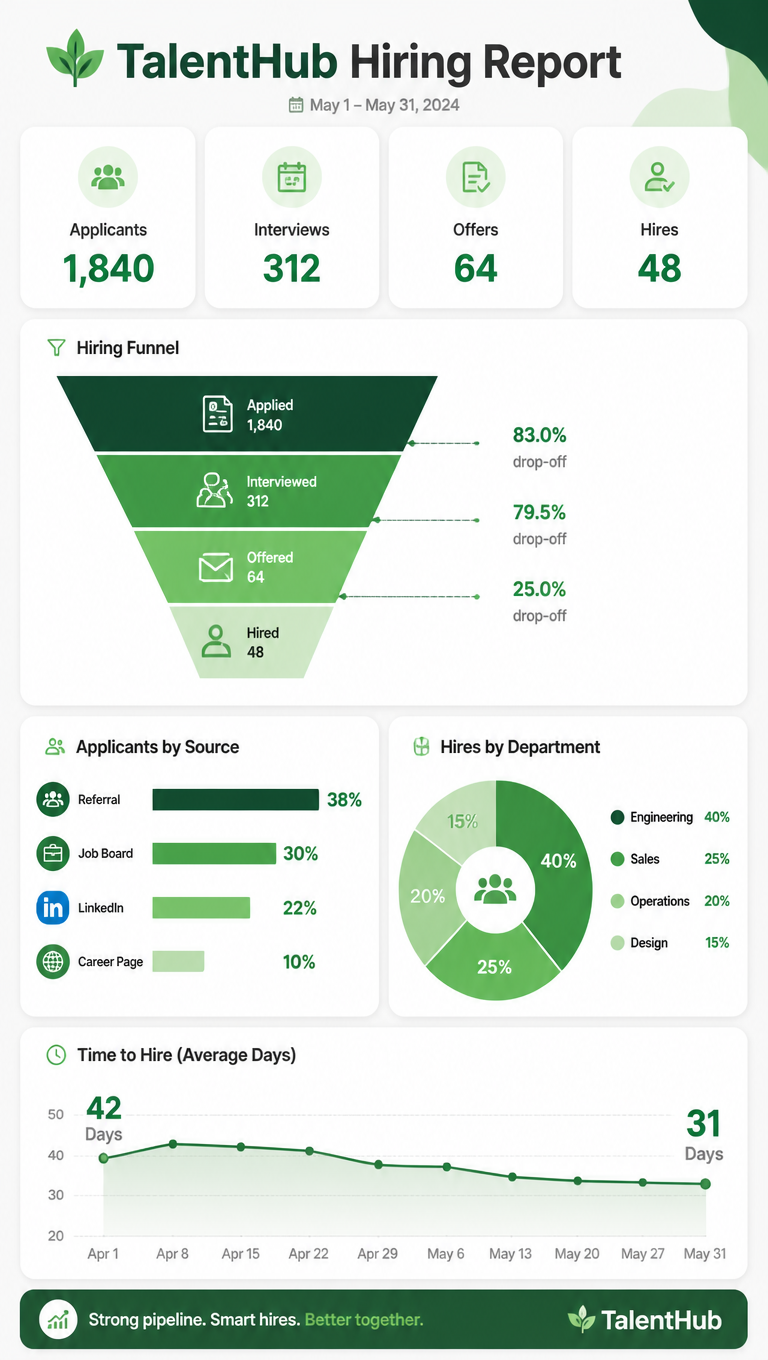
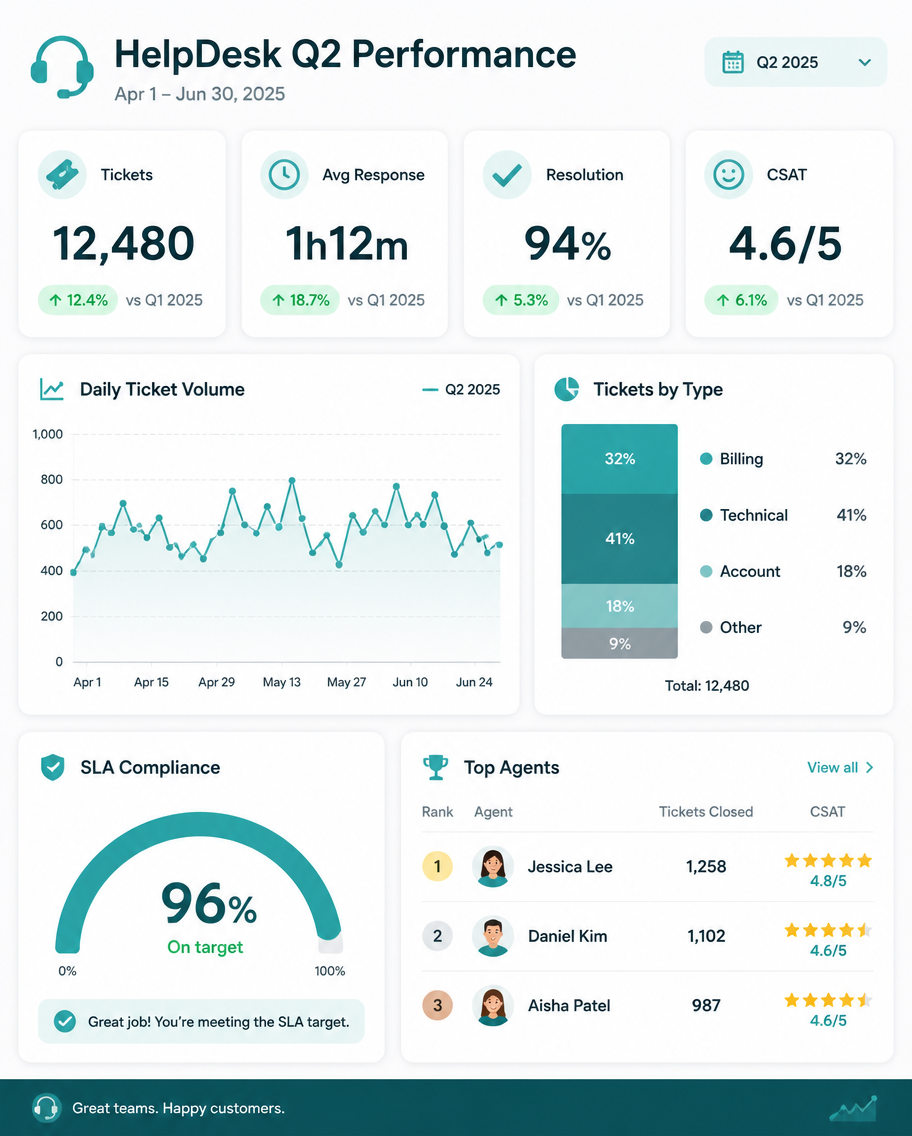
A dashboard infographic, 4:5, titled 'HelpDesk Q2 Performance'. A report slide with four KPI cards: Tickets 12,480, Avg Response 1h12m, Resolution 94%, CSAT 4.6/5. A line chart tracks daily ticket volume, a stacked bar splits ticket type (Billing 32%, Technical 41%, Account 18%, Other 9%), and a gauge shows SLA compliance at 96%. A small agent-leaderboard card lists three top performers with star ratings. Calm teal-and-white palette, rounded widgets on a light grid, green trend badges, tidy professional support-dashboard aesthetic.How to use
- Copy the complete original prompt, including any parameters.
- Replace the subject, text and composition with your own requirements.
- Use a compatible external tool; check its current access conditions and review the result.
Before you start
- Check whether a reference image is required. A compatible model label does not mean this example was generated with that model.
- Keep names, figures and visible text accurate; results can vary between model versions.