Oryginalny dokument
GPT Image 2 · en
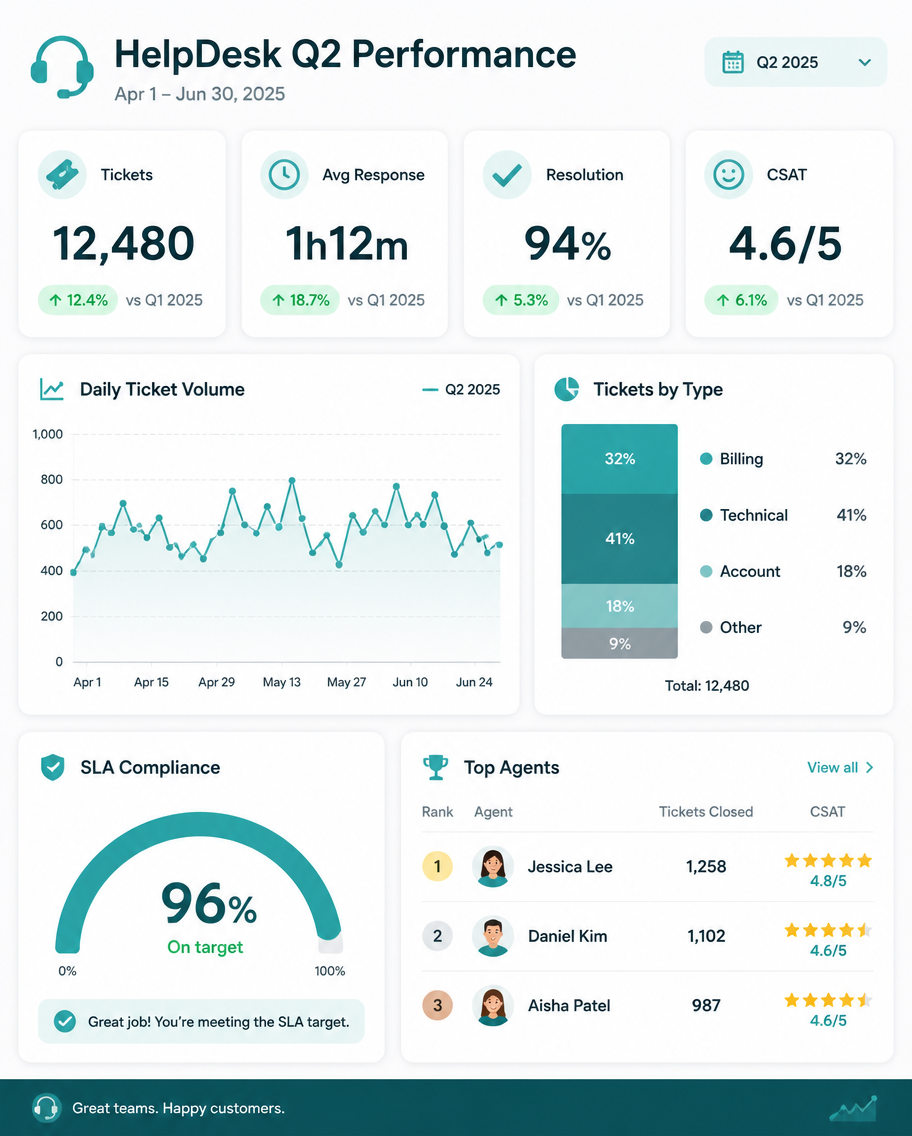
A dashboard infographic, 4:5, titled 'HelpDesk Q2 Performance'. A report slide with four KPI cards: Tickets 12,480, Avg Response 1h12m, Resolution 94%, CSAT 4.6/5. A line chart tracks daily ticket volume, a stacked bar splits ticket type (Billing 32%, Technical 41%, Account 18%, Other 9%), and a gauge shows SLA compliance at 96%. A small agent-leaderboard card lists three top performers with star ratings. Calm teal-and-white palette, rounded widgets on a light grid, green trend badges, tidy professional support-dashboard aesthetic.Jak używać
- Skopiuj cały oryginalny prompt wraz z parametrami.
- Dostosuj temat, tekst i kompozycję do swoich potrzeb.
- Użyj zgodnego narzędzia zewnętrznego; sprawdź warunki dostępu i wynik.
Przed rozpoczęciem
- Sprawdź, czy potrzebny jest obraz referencyjny. Zgodność nie potwierdza modelu użytego do przykładu.
- Sprawdź nazwy, liczby i napisy; wyniki zależą od wersji modelu.