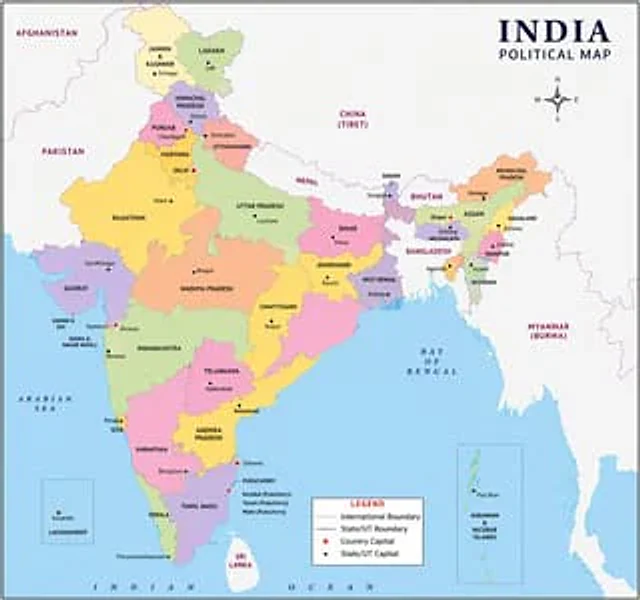
Political Map Visualization

Political Map Visualization

Original document

GPT Image 2 · en

One{argument name="region" default="indian"} Images of political maps

How to use

  1. Copy the complete original prompt, including any parameters.
  2. Replace the subject, text and composition with your own requirements.
  3. Use a compatible external tool; check its current access conditions and review the result.

Before you start

  • Check whether a reference image is required. A compatible model label does not mean this example was generated with that model.
  • Keep names, figures and visible text accurate; results can vary between model versions.
More like this

Full Stack Knowledge Visualization
GPT Image 2en

right{argument name="subject" default="Basic Web Full-Stack Knowledge Required for Ordinary People to Perform VibeCoding"} Visual presentations, and what can be created{argument name="count" default="Top 10"} Full-stack project demonstration.

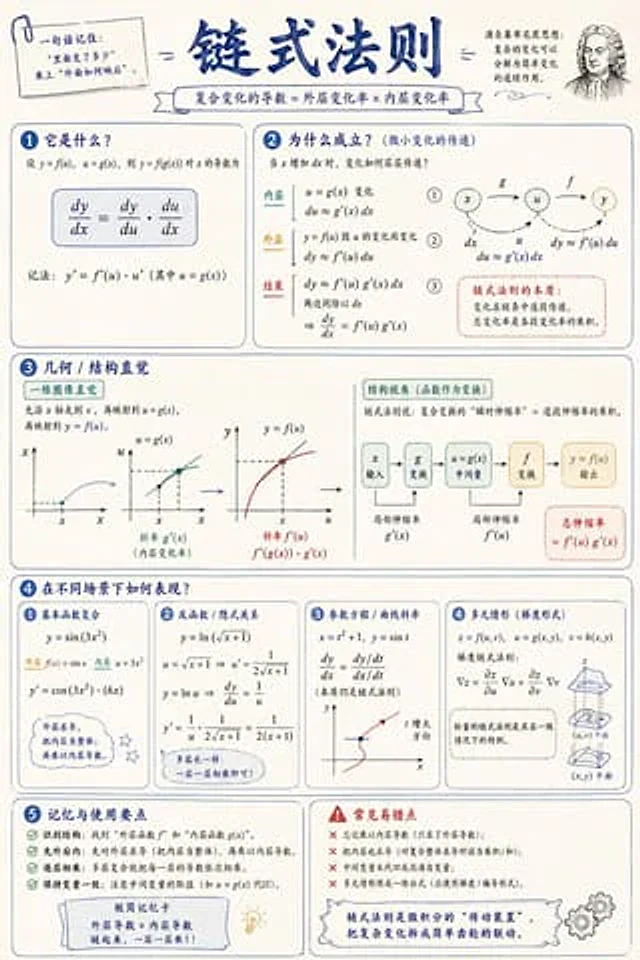
Mathematical Visualization Infographic Prompt
GPT Image 2zh

请创作一张关于「{argument name="知识点" default="数学概念/知识点"}」的数学可视化信息图,目标是帮助读者直观理解:它是什么、为什么成立、几何/结构直觉是什么、在不同场景下如何表现。画面要像高质量数学讲义 + 手绘教育海报,优雅、清晰、信息丰富,但不要杂乱。 视觉风格:{argument name="画面比例" default="竖版或横版均可"},干净的浅色纸张背景,深蓝标题,黑色/深灰正文线条,搭配少量优雅的蓝色、青绿色、金色、红色强调色。使用圆角卡片、细线边框、编号标签、手绘箭头、局部放大框和总结栏。整体要美观、平衡、有

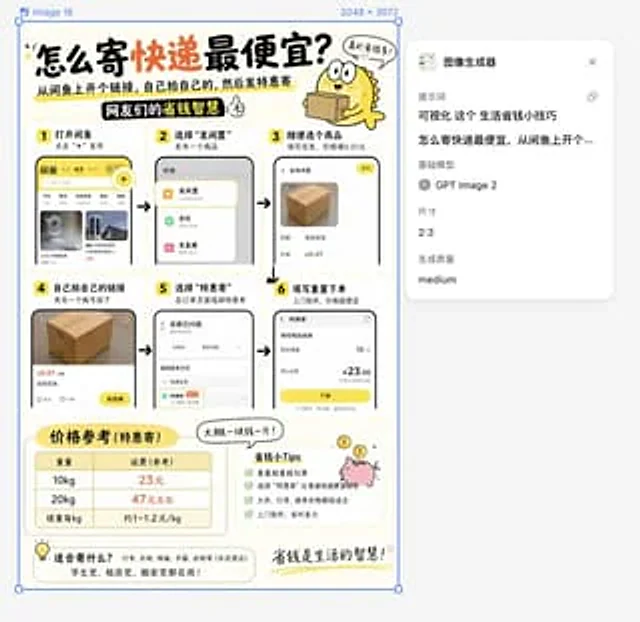
Life Hack Visualization
GPT Image 2en

Visualize this content{argument name="topic" default="Money-saving tips for daily life"}{argument name="specific tip" default="How to send a package at the cheapest price: Create a link on Xianyu (a second-hand marketplace), place the order yourself, and then use the discount for