Original document
GPT Image 2 · en
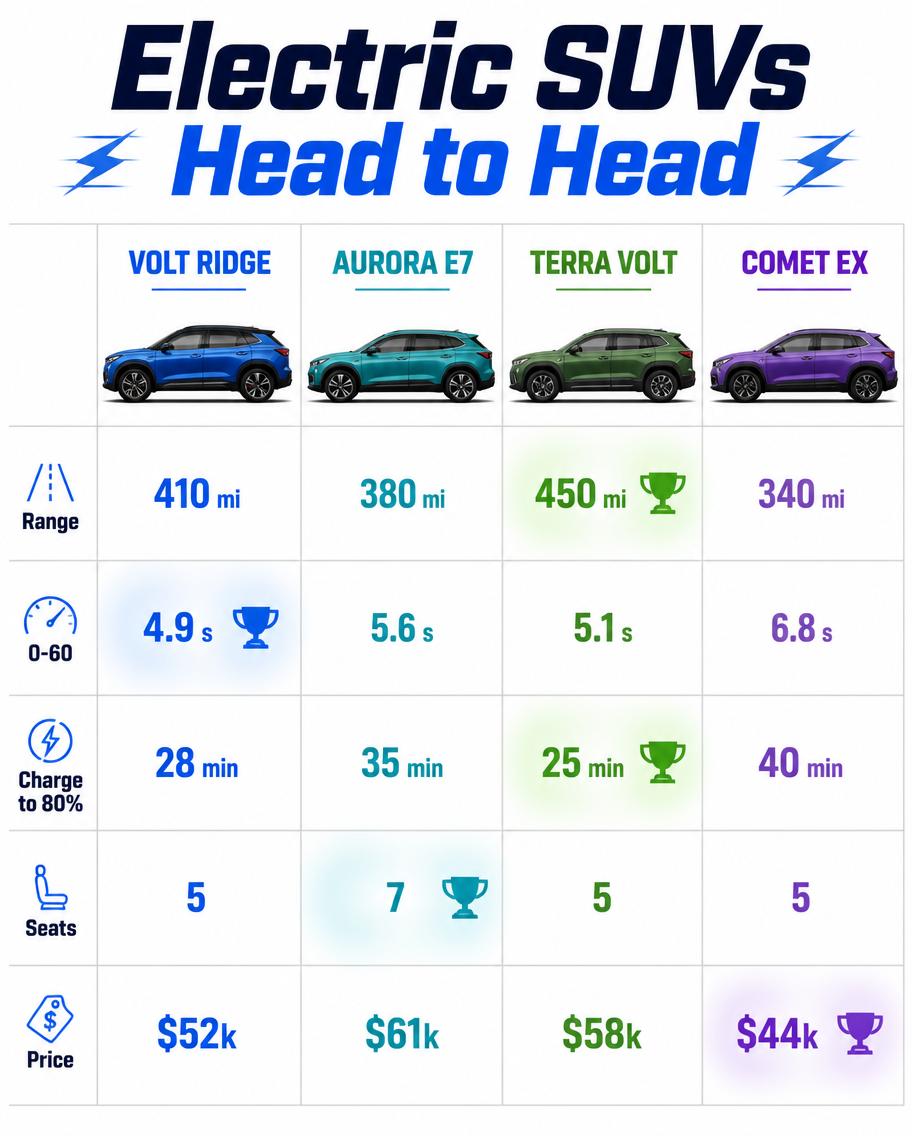
A vehicle comparison infographic, 4:5, titled 'Electric SUVs Head to Head'. A four-column table for invented EVs: Volt Ridge, Aurora E7, Terra Volt, Comet EX. Side-profile car illustrations top each column in matching accent colors. Rows: Range (410 vs 380 vs 450 vs 340 mi), 0-60 (4.9 vs 5.6 vs 5.1 vs 6.8 s), Charge to 80% (28 vs 35 vs 25 vs 40 min), Seats (5 vs 7 vs 5 vs 5), Price ($52k vs $61k vs $58k vs $44k). Best-in-row values glow with a small trophy icon. Clean white background, electric-blue and green palette, bold headers, sharp modern typography.How to use
- Copy the complete original prompt, including any parameters.
- Replace the subject, text and composition with your own requirements.
- Use a compatible external tool; check its current access conditions and review the result.
Before you start
- Check whether a reference image is required. A compatible model label does not mean this example was generated with that model.
- Keep names, figures and visible text accurate; results can vary between model versions.