Documento original
GPT Image 2 · en
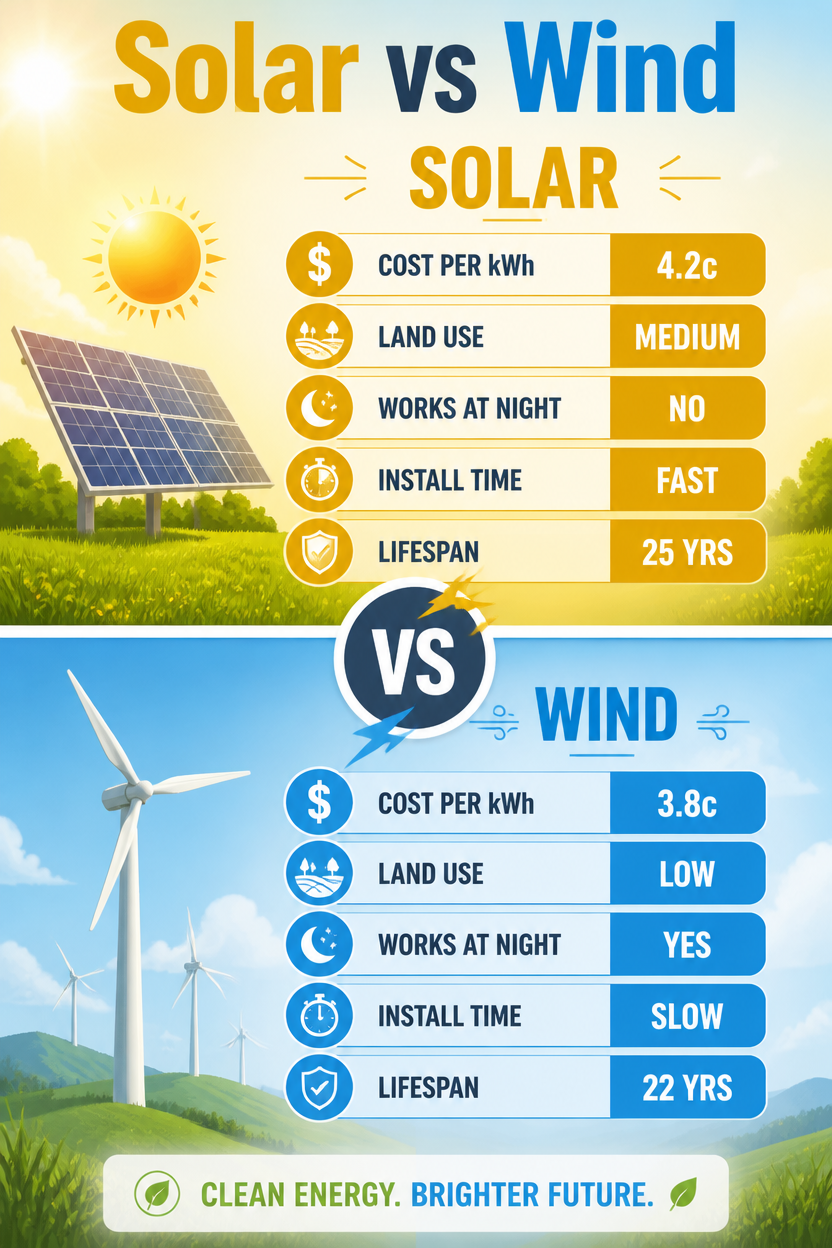
An energy versus infographic, 2:3, titled 'Solar vs Wind'. Vertical split: top gold 'Solar', bottom sky-blue 'Wind', joined by a central 'VS' emblem. Matched rows with icons: cost per kWh (4.2c vs 3.8c), land use (medium vs low), works at night (no vs yes), install time (fast vs slow), lifespan (25 vs 22 yrs). Sun-panel vs turbine icons top each half. Clean flat design, soft gradient sky background, rounded stat bars, hopeful bright renewable-energy aesthetic, balanced symmetrical layout, bold clean headings.Cómo usar
- Copia el prompt original completo, incluidos los parámetros.
- Adapta el tema, el texto y la composición a tus necesidades.
- Usa una herramienta externa compatible; comprueba el acceso y el resultado.
Antes de empezar
- Comprueba si necesita una imagen de referencia. La compatibilidad no demuestra qué modelo generó el ejemplo.
- Revisa nombres, cifras y textos; el resultado puede variar entre versiones del modelo.