Design illustration · Solar Vs Wind Energy — API Models · CC BY 4.0

Design illustration · Solar Vs Wind Energy — API Models · CC BY 4.0

원본 문서

GPT Image 2 · en

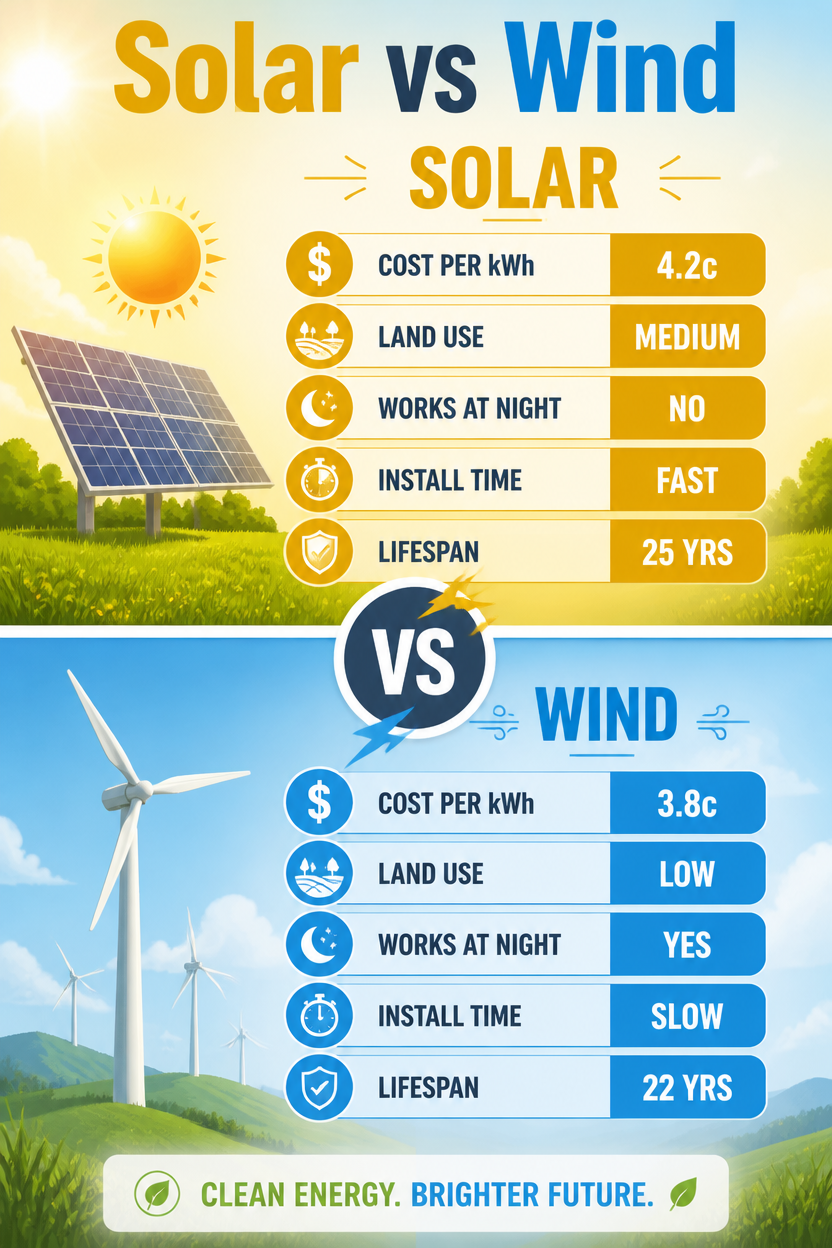
An energy versus infographic, 2:3, titled 'Solar vs Wind'. Vertical split: top gold 'Solar', bottom sky-blue 'Wind', joined by a central 'VS' emblem. Matched rows with icons: cost per kWh (4.2c vs 3.8c), land use (medium vs low), works at night (no vs yes), install time (fast vs slow), lifespan (25 vs 22 yrs). Sun-panel vs turbine icons top each half. Clean flat design, soft gradient sky background, rounded stat bars, hopeful bright renewable-energy aesthetic, balanced symmetrical layout, bold clean headings.

사용 방법

  1. 매개변수를 포함한 전체 원본 프롬프트를 복사하세요.
  2. 주제, 문구, 구도를 자신의 요구에 맞게 바꾸세요.
  3. 호환되는 외부 도구에서 사용하고 이용 조건과 결과를 확인하세요.

시작 전 확인

  • 참조 이미지가 필요한지 확인하세요. 호환 표시는 해당 모델로 이 예시를 생성했다는 뜻이 아닙니다.
  • 이름, 수치, 이미지 속 문구를 확인하세요. 모델 버전에 따라 결과가 다를 수 있습니다.
비슷한 예시

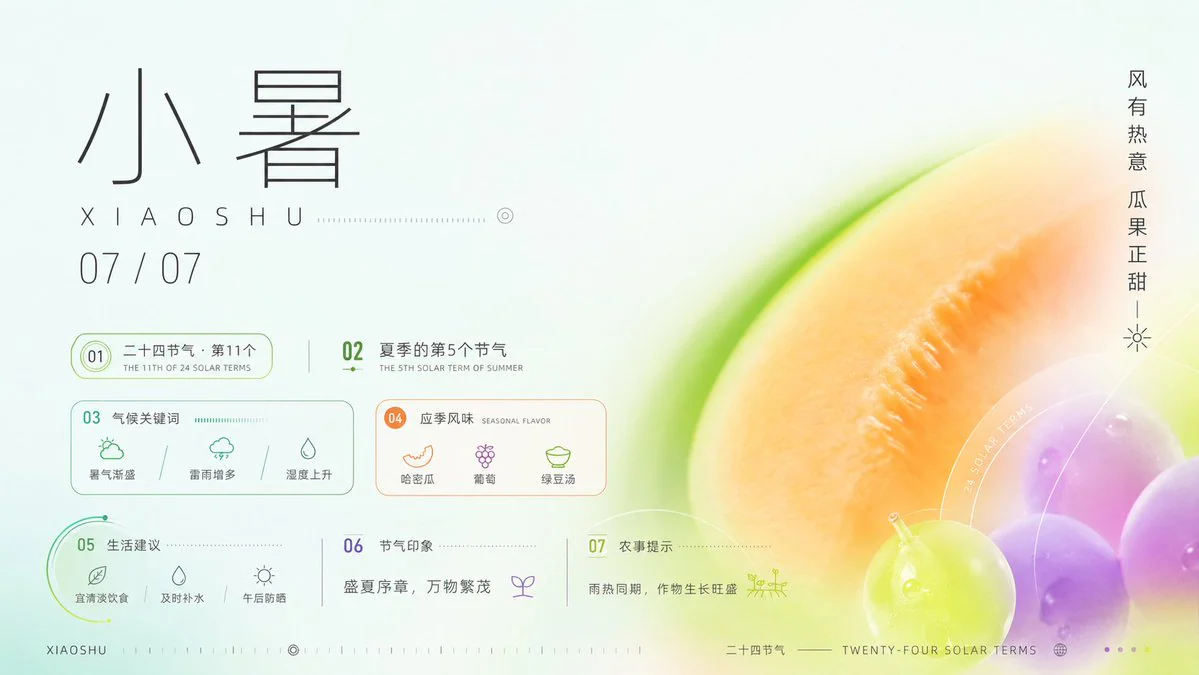
Xiaoshu Solar Term Infographic Poster
GPT Image 2en

Goal: Create a refined horizontal Chinese solar-term infographic poster for {argument name="solar term name" default="小暑"}, combining traditional calendar information with a fresh summer dessert and melon color palette. Canvas: 16:9 landscape poster, pale mint-white background,

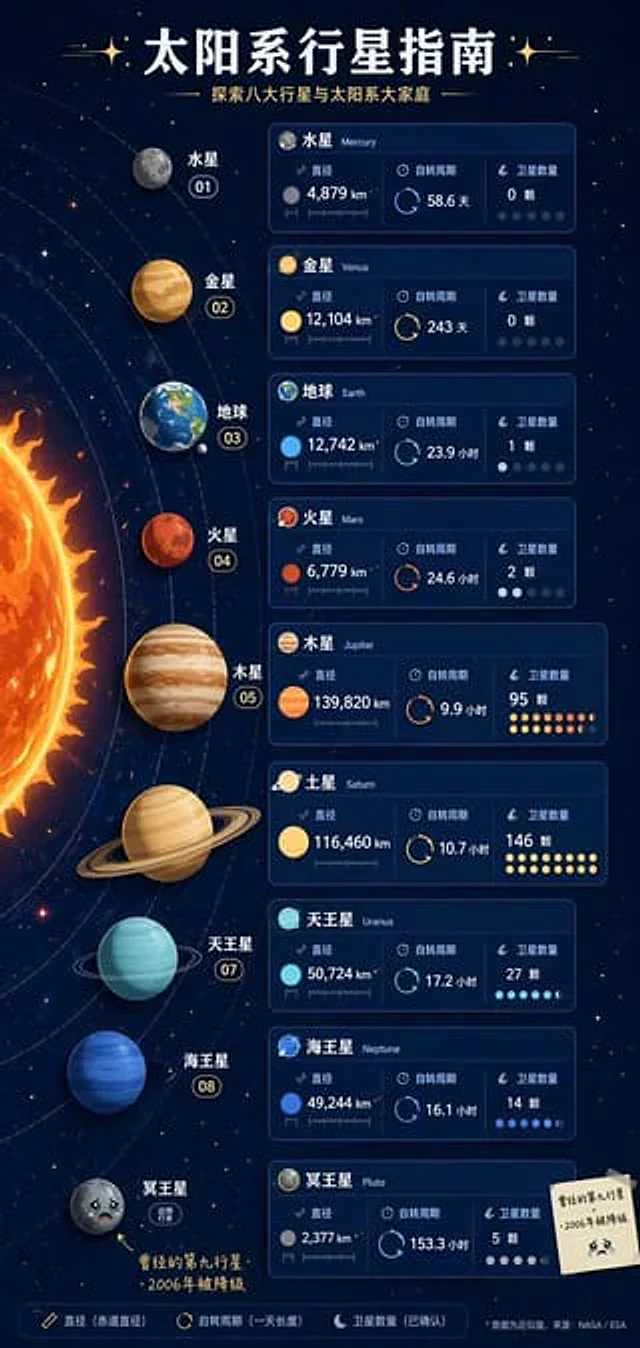
Solar System Infographic Poster
GPT Image 2en

The "Solar System Planet Guide" vertical infographic poster features a side view of the solar system, with each planet accompanied by an "ID card" containing information such as its diameter, rotation period, and number of moons. Pluto is marked on the edge with the small print: