Design illustration · Solar Vs Wind Energy — API Models · CC BY 4.0

Design illustration · Solar Vs Wind Energy — API Models · CC BY 4.0

原文

GPT Image 2 · en

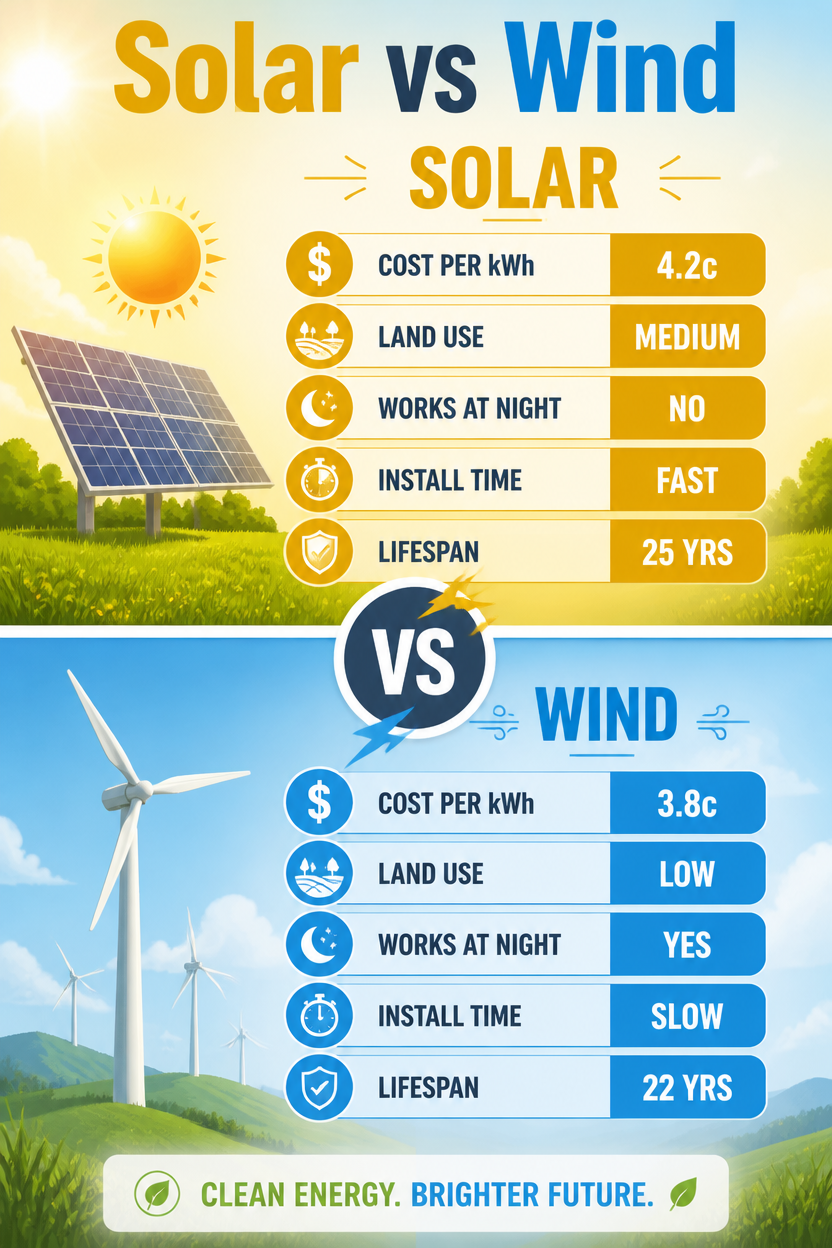
An energy versus infographic, 2:3, titled 'Solar vs Wind'. Vertical split: top gold 'Solar', bottom sky-blue 'Wind', joined by a central 'VS' emblem. Matched rows with icons: cost per kWh (4.2c vs 3.8c), land use (medium vs low), works at night (no vs yes), install time (fast vs slow), lifespan (25 vs 22 yrs). Sun-panel vs turbine icons top each half. Clean flat design, soft gradient sky background, rounded stat bars, hopeful bright renewable-energy aesthetic, balanced symmetrical layout, bold clean headings.

使い方

  1. パラメータを含む元のプロンプト全体をコピーします。
  2. 被写体、文字、構図を自分の要件に置き換えます。
  3. 対応する外部ツールで使用し、利用条件と結果を確認します。

開始前の確認

  • 参考画像の要否を確認してください。互換モデルの表示は、そのモデルでの生成実績を意味しません。
  • 名前、数値、画像内の文字を確認します。モデルの版で結果は変わります。

似た事例

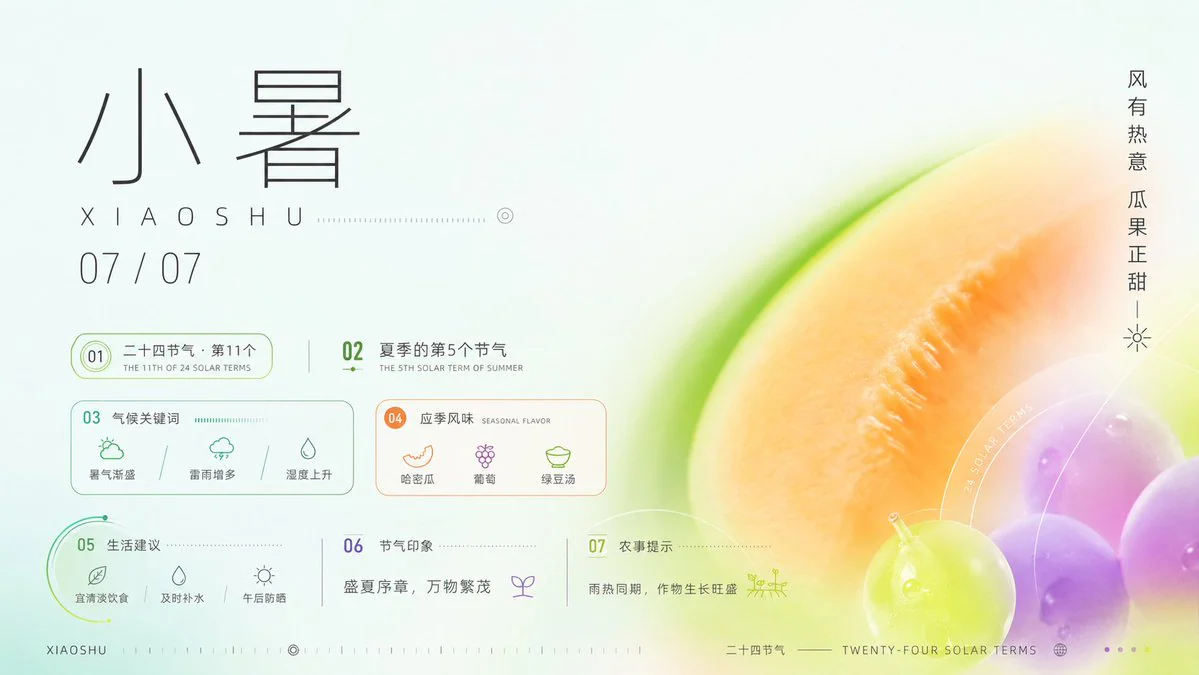
Xiaoshu Solar Term Infographic Poster
GPT Image 2en

Goal: Create a refined horizontal Chinese solar-term infographic poster for {argument name="solar term name" default="小暑"}, combining traditional calendar information with a fresh summer dessert and melon color palette. Canvas: 16:9 landscape poster, pale mint-white background,

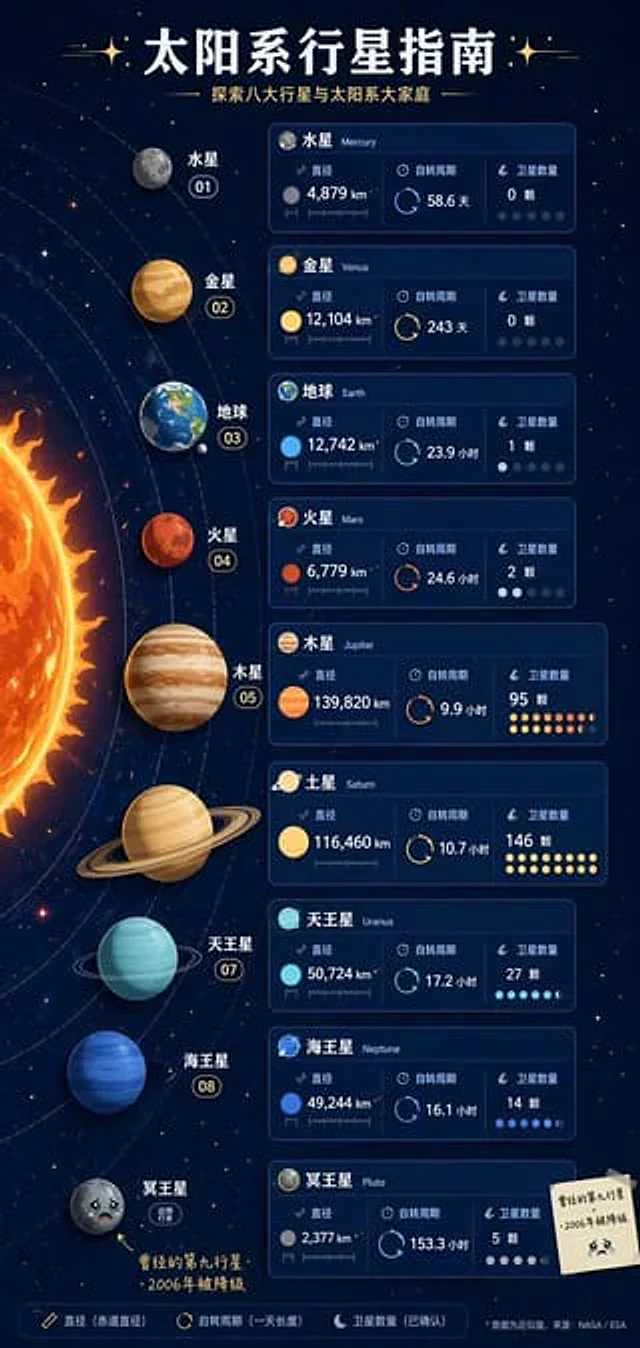
Solar System Infographic Poster
GPT Image 2en

The "Solar System Planet Guide" vertical infographic poster features a side view of the solar system, with each planet accompanied by an "ID card" containing information such as its diameter, rotation period, and number of moons. Pluto is marked on the edge with the small print: