Oryginalny dokument
GPT Image 2 · en
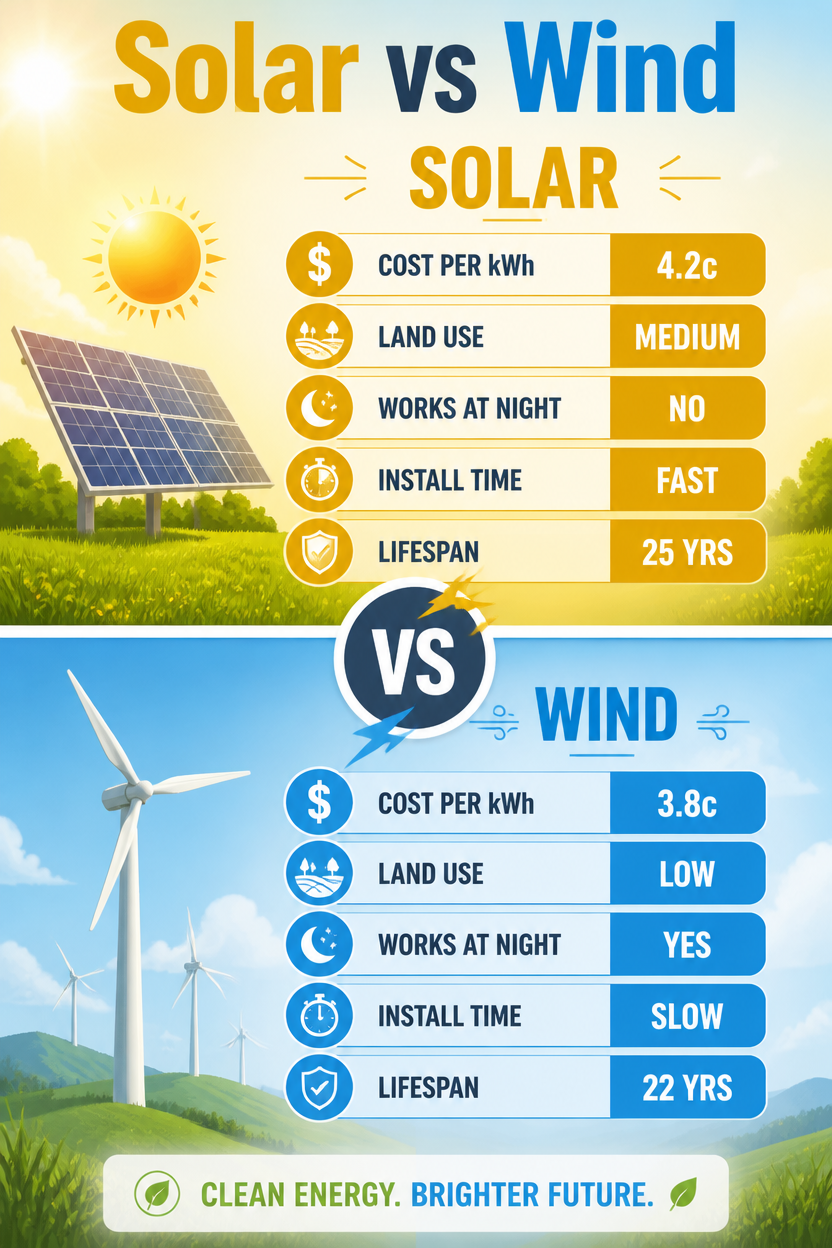
An energy versus infographic, 2:3, titled 'Solar vs Wind'. Vertical split: top gold 'Solar', bottom sky-blue 'Wind', joined by a central 'VS' emblem. Matched rows with icons: cost per kWh (4.2c vs 3.8c), land use (medium vs low), works at night (no vs yes), install time (fast vs slow), lifespan (25 vs 22 yrs). Sun-panel vs turbine icons top each half. Clean flat design, soft gradient sky background, rounded stat bars, hopeful bright renewable-energy aesthetic, balanced symmetrical layout, bold clean headings.Jak używać
- Skopiuj cały oryginalny prompt wraz z parametrami.
- Dostosuj temat, tekst i kompozycję do swoich potrzeb.
- Użyj zgodnego narzędzia zewnętrznego; sprawdź warunki dostępu i wynik.
Przed rozpoczęciem
- Sprawdź, czy potrzebny jest obraz referencyjny. Zgodność nie potwierdza modelu użytego do przykładu.
- Sprawdź nazwy, liczby i napisy; wyniki zależą od wersji modelu.