Design illustration · Solar Vs Wind Energy — API Models · CC BY 4.0

Design illustration · Solar Vs Wind Energy — API Models · CC BY 4.0

原始文档

GPT Image 2 · en

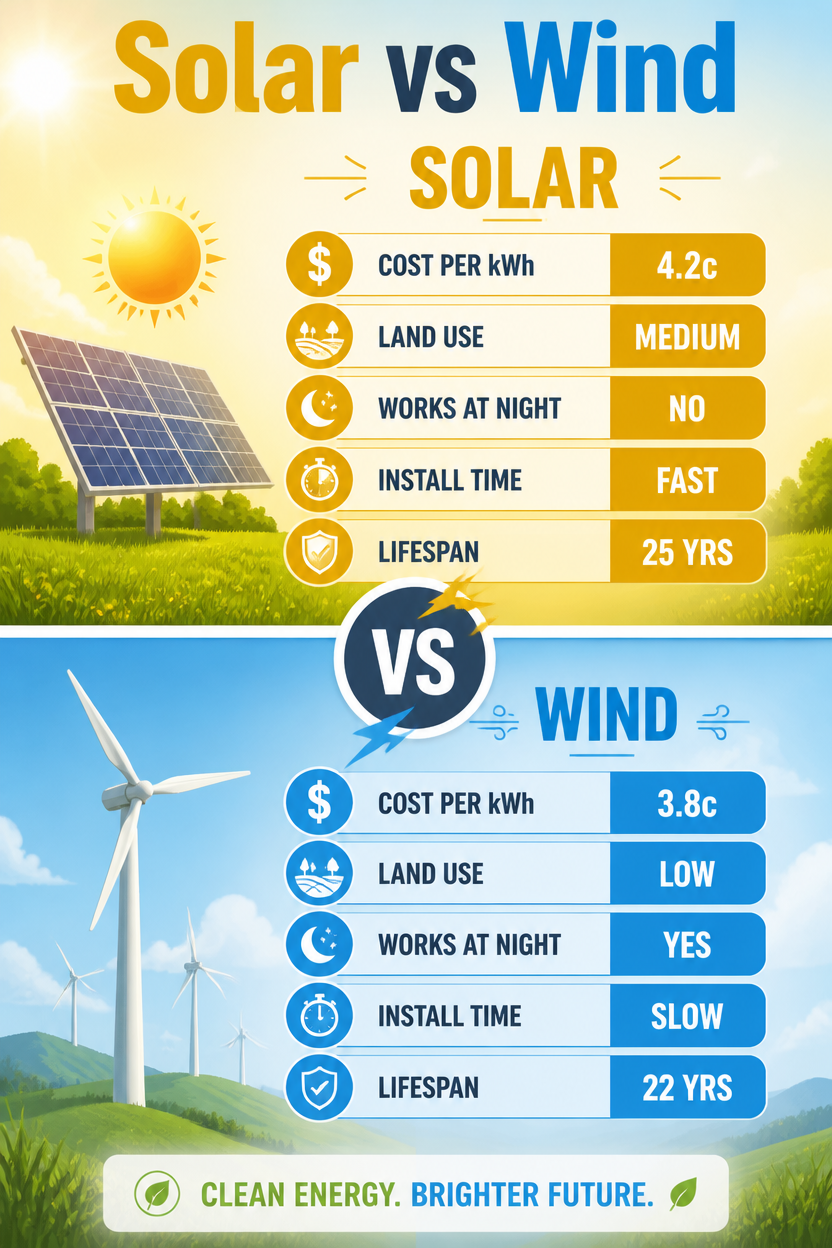
An energy versus infographic, 2:3, titled 'Solar vs Wind'. Vertical split: top gold 'Solar', bottom sky-blue 'Wind', joined by a central 'VS' emblem. Matched rows with icons: cost per kWh (4.2c vs 3.8c), land use (medium vs low), works at night (no vs yes), install time (fast vs slow), lifespan (25 vs 22 yrs). Sun-panel vs turbine icons top each half. Clean flat design, soft gradient sky background, rounded stat bars, hopeful bright renewable-energy aesthetic, balanced symmetrical layout, bold clean headings.

使用方法

  1. 复制完整原始提示词,并保留其中的参数。
  2. 按需求替换主体、文字和构图要求。
  3. 在兼容的外部工具中使用,核对当前使用条件并检查结果。

开始前需了解

  • 先确认是否需要参考图。标注兼容模型,不代表该示例由这个模型生成。
  • 核对名称、数字与画面文字;不同模型版本的结果可能不同。

相似案例

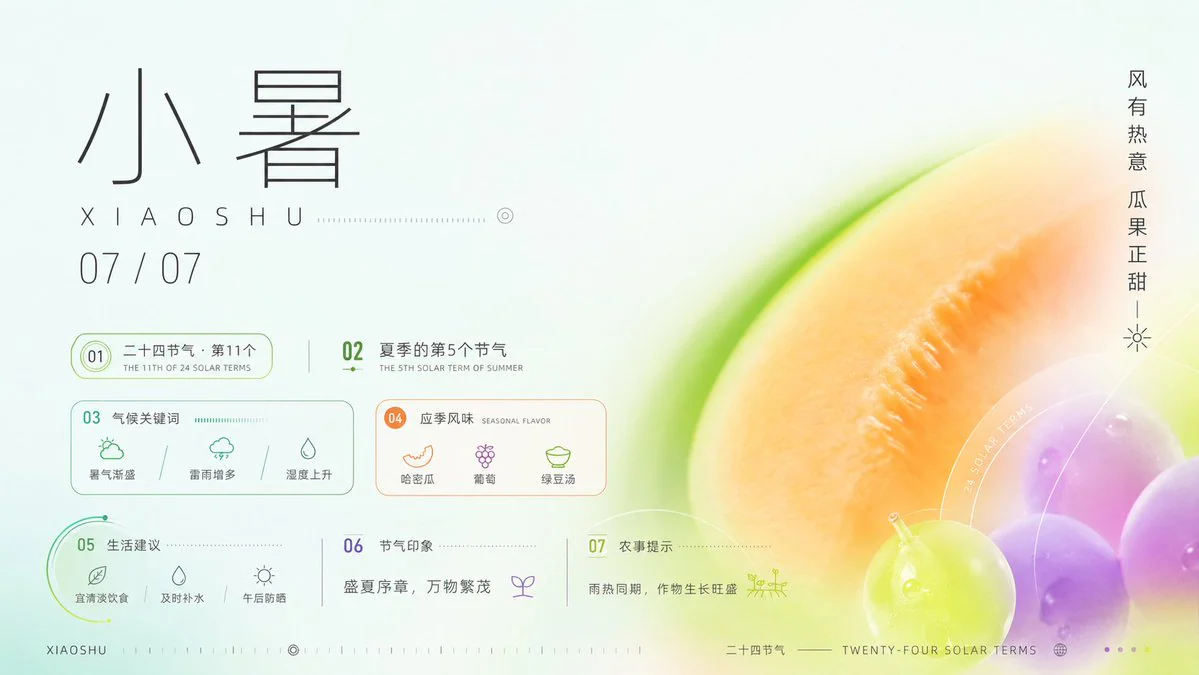
Xiaoshu Solar Term Infographic Poster
GPT Image 2en

Goal: Create a refined horizontal Chinese solar-term infographic poster for {argument name="solar term name" default="小暑"}, combining traditional calendar information with a fresh summer dessert and melon color palette. Canvas: 16:9 landscape poster, pale mint-white background,

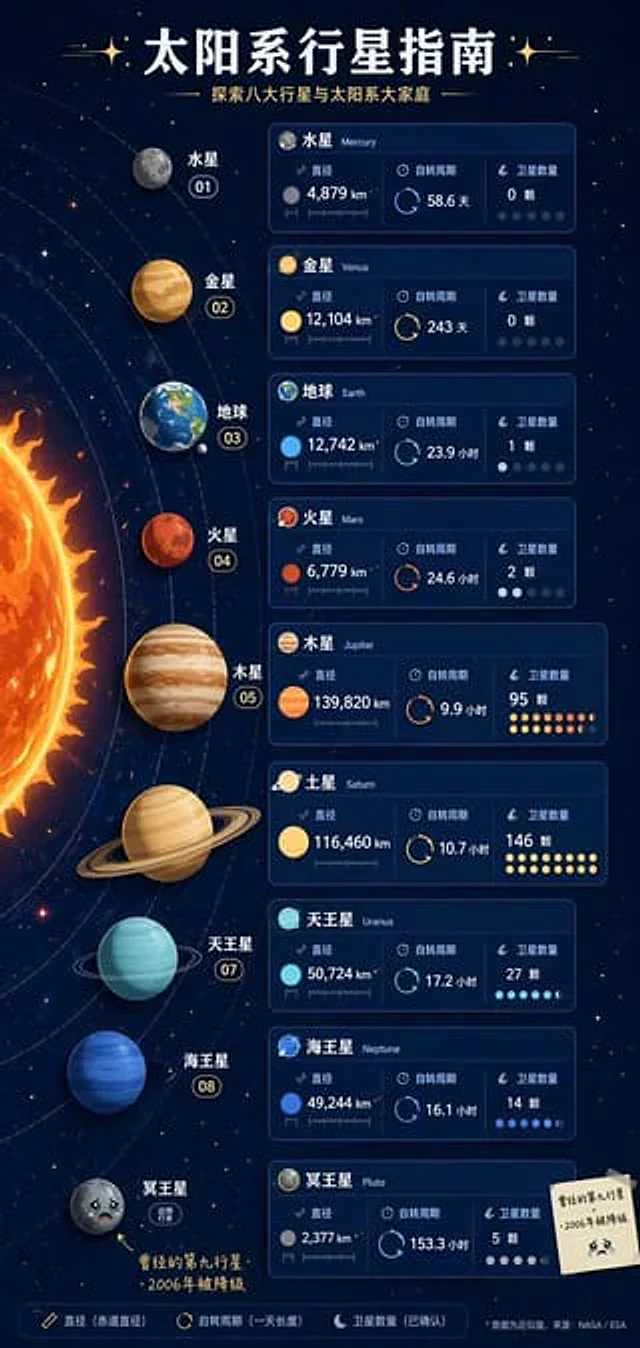
Solar System Infographic Poster
GPT Image 2en

The "Solar System Planet Guide" vertical infographic poster features a side view of the solar system, with each planet accompanied by an "ID card" containing information such as its diameter, rotation period, and number of moons. Pluto is marked on the edge with the small print: