Document original
GPT Image 2 · en
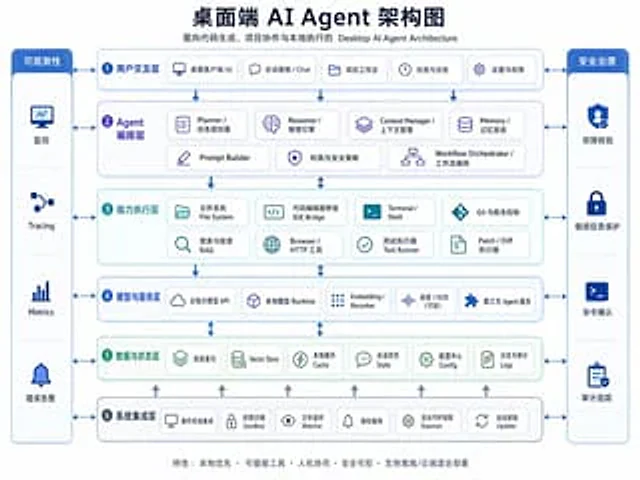
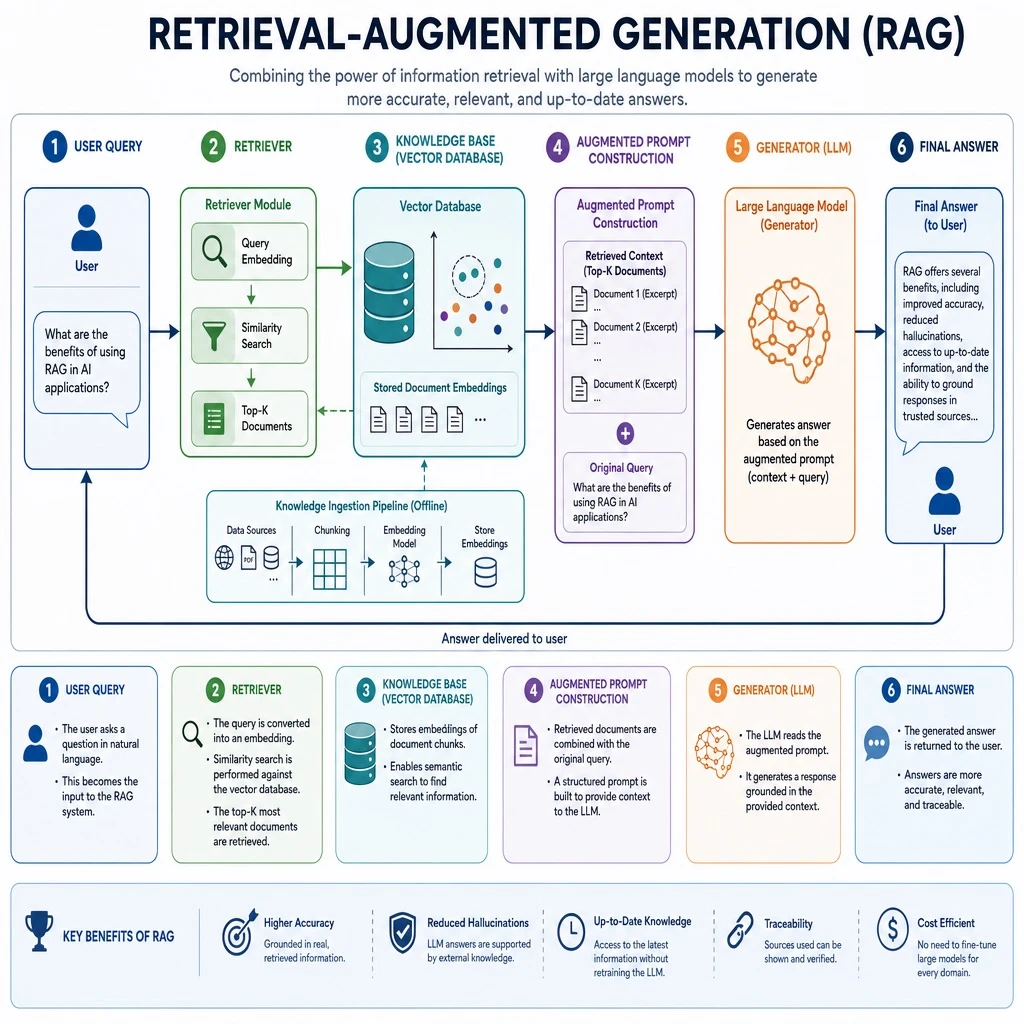
Create a detailed technical infographic explaining Retrieval-Augmented Generation (RAG) technology. Illustrate the full architecture and workflow, including the user query, the retriever module, the knowledge base or vector database, the augmented prompt construction step, and the generator (large language model) that produces the final answer. Use clearly labeled boxes and directional arrows to show the data flow between each stage. Apply a clean, modern chart style with a coherent color palette, readable typography, well-organized layout, and a professional look suitable for a technical presentation slide.Mode d’emploi
- Copiez le prompt original complet, paramètres compris.
- Adaptez le sujet, le texte et la composition à vos besoins.
- Utilisez un outil externe compatible ; vérifiez l’accès et le résultat.
Avant de commencer
- Vérifiez si une image de référence est nécessaire. La compatibilité ne prouve pas le modèle utilisé pour cet exemple.
- Vérifiez noms, chiffres et textes ; les versions du modèle peuvent produire des résultats différents.