Oryginalny dokument
GPT Image 2 · en
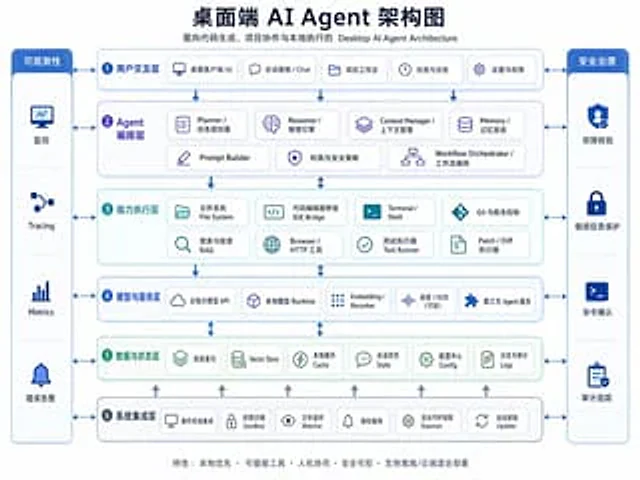
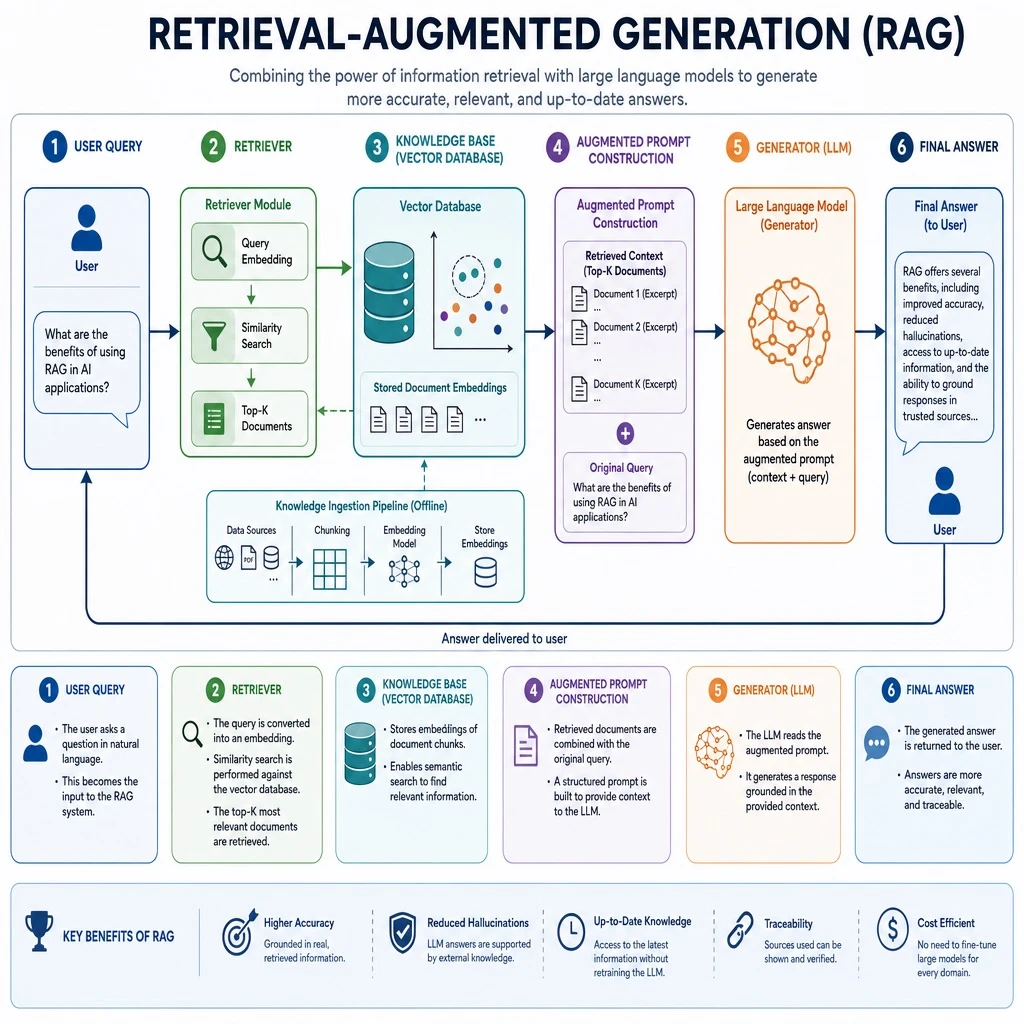
Create a detailed technical infographic explaining Retrieval-Augmented Generation (RAG) technology. Illustrate the full architecture and workflow, including the user query, the retriever module, the knowledge base or vector database, the augmented prompt construction step, and the generator (large language model) that produces the final answer. Use clearly labeled boxes and directional arrows to show the data flow between each stage. Apply a clean, modern chart style with a coherent color palette, readable typography, well-organized layout, and a professional look suitable for a technical presentation slide.Jak używać
- Skopiuj cały oryginalny prompt wraz z parametrami.
- Dostosuj temat, tekst i kompozycję do swoich potrzeb.
- Użyj zgodnego narzędzia zewnętrznego; sprawdź warunki dostępu i wynik.
Przed rozpoczęciem
- Sprawdź, czy potrzebny jest obraz referencyjny. Zgodność nie potwierdza modelu użytego do przykładu.
- Sprawdź nazwy, liczby i napisy; wyniki zależą od wersji modelu.