Original document
GPT Image 2 · en
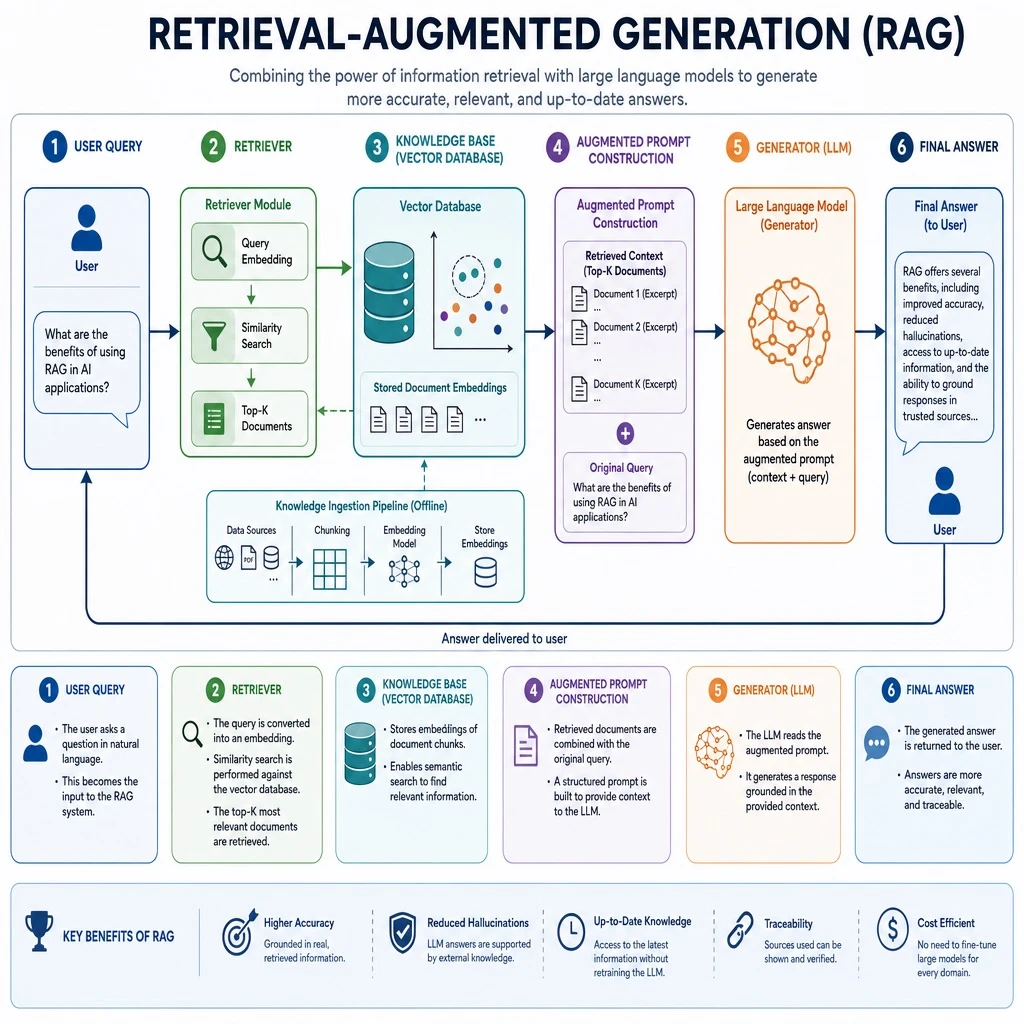
Create a detailed technical infographic explaining Retrieval-Augmented Generation (RAG) technology. Illustrate the full architecture and workflow, including the user query, the retriever module, the knowledge base or vector database, the augmented prompt construction step, and the generator (large language model) that produces the final answer. Use clearly labeled boxes and directional arrows to show the data flow between each stage. Apply a clean, modern chart style with a coherent color palette, readable typography, well-organized layout, and a professional look suitable for a technical presentation slide.How to use
- Copy the complete original prompt, including any parameters.
- Replace the subject, text and composition with your own requirements.
- Use a compatible external tool; check its current access conditions and review the result.
Before you start
- Check whether a reference image is required. A compatible model label does not mean this example was generated with that model.
- Keep names, figures and visible text accurate; results can vary between model versions.