Documento originale
GPT Image 2 · en
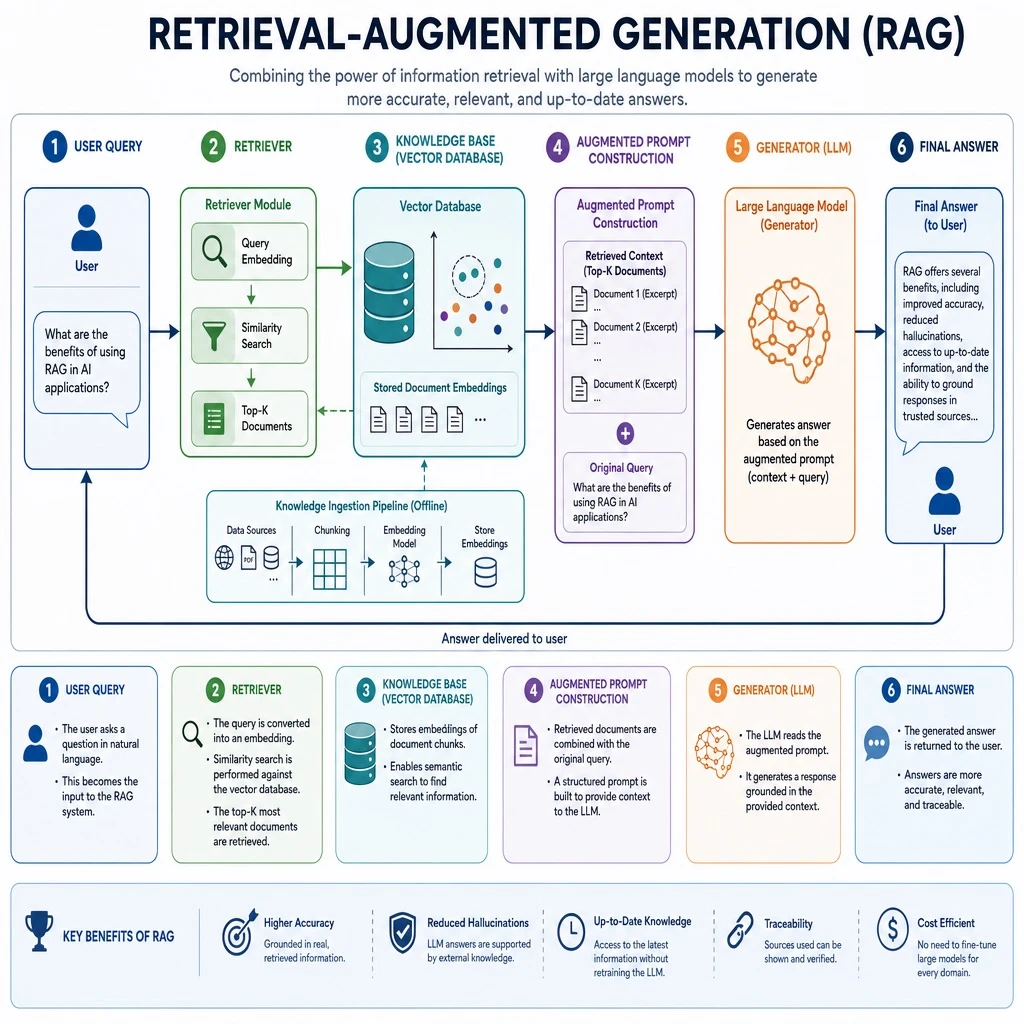
Create a detailed technical infographic explaining Retrieval-Augmented Generation (RAG) technology. Illustrate the full architecture and workflow, including the user query, the retriever module, the knowledge base or vector database, the augmented prompt construction step, and the generator (large language model) that produces the final answer. Use clearly labeled boxes and directional arrows to show the data flow between each stage. Apply a clean, modern chart style with a coherent color palette, readable typography, well-organized layout, and a professional look suitable for a technical presentation slide.Come usare
- Copia tutto il prompt originale, inclusi i parametri.
- Adatta soggetto, testo e composizione alle tue esigenze.
- Usa uno strumento esterno compatibile; verifica accesso e risultato.
Prima di iniziare
- Controlla se serve un’immagine di riferimento. La compatibilità non prova il modello usato per l’esempio.
- Verifica nomi, numeri e testi; i risultati cambiano con le versioni del modello.