原文
GPT Image 2 · en
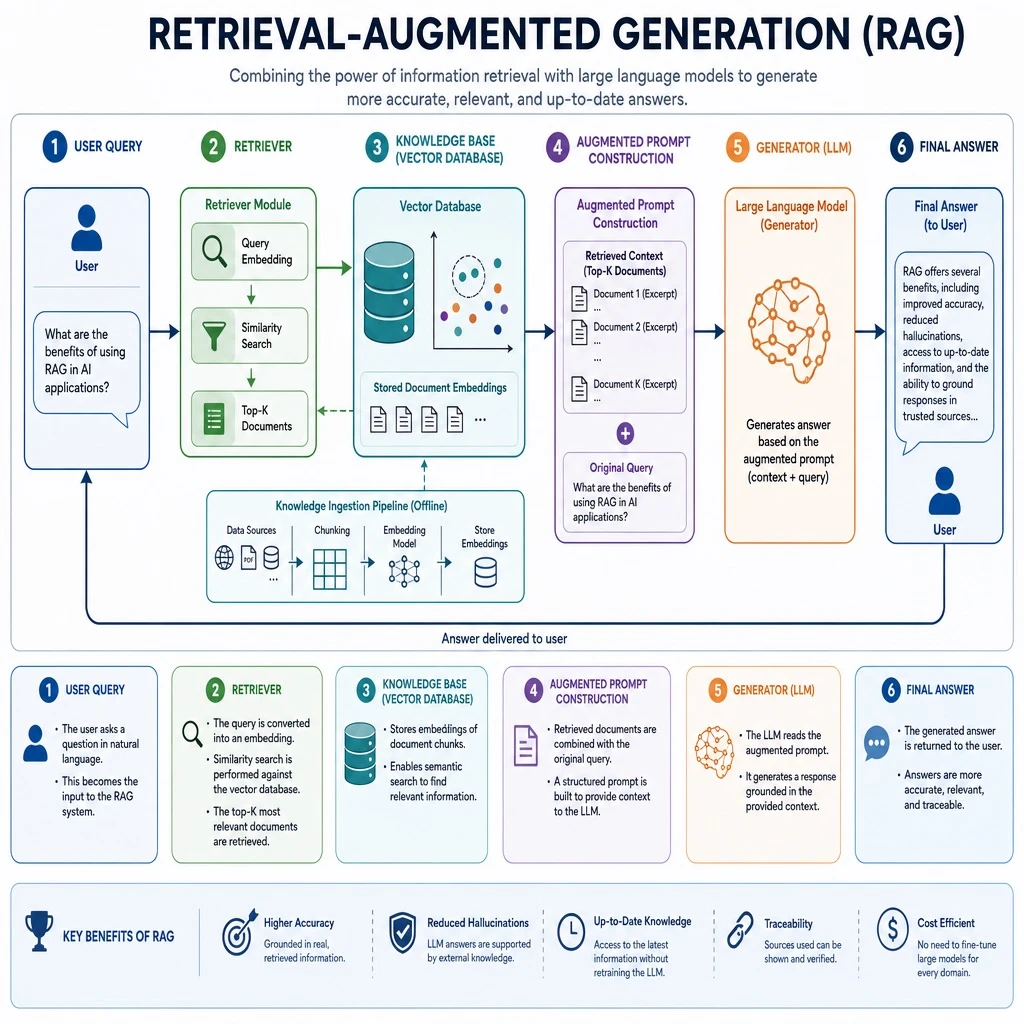
Create a detailed technical infographic explaining Retrieval-Augmented Generation (RAG) technology. Illustrate the full architecture and workflow, including the user query, the retriever module, the knowledge base or vector database, the augmented prompt construction step, and the generator (large language model) that produces the final answer. Use clearly labeled boxes and directional arrows to show the data flow between each stage. Apply a clean, modern chart style with a coherent color palette, readable typography, well-organized layout, and a professional look suitable for a technical presentation slide.使い方
- パラメータを含む元のプロンプト全体をコピーします。
- 被写体、文字、構図を自分の要件に置き換えます。
- 対応する外部ツールで使用し、利用条件と結果を確認します。
開始前の確認
- 参考画像の要否を確認してください。互換モデルの表示は、そのモデルでの生成実績を意味しません。
- 名前、数値、画像内の文字を確認します。モデルの版で結果は変わります。