Document original
GPT Image 2 · en
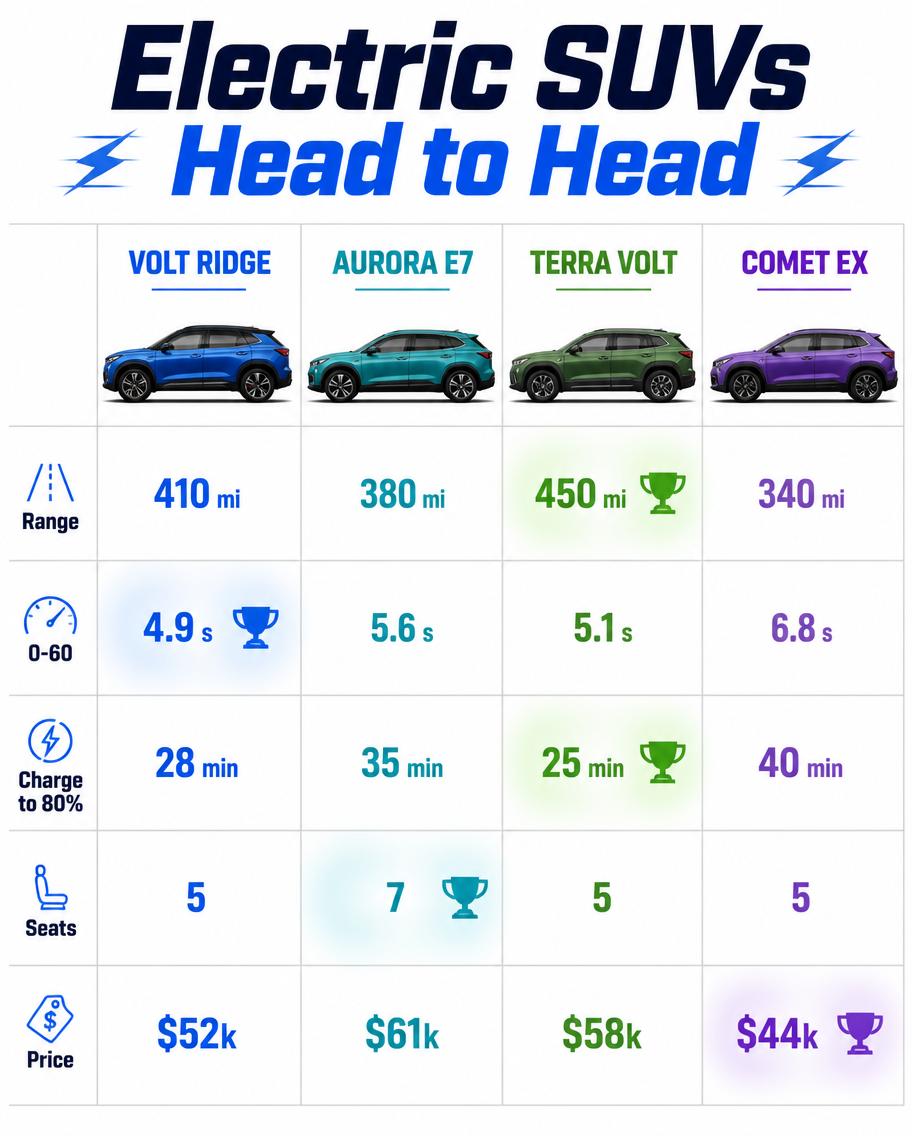
A vehicle comparison infographic, 4:5, titled 'Electric SUVs Head to Head'. A four-column table for invented EVs: Volt Ridge, Aurora E7, Terra Volt, Comet EX. Side-profile car illustrations top each column in matching accent colors. Rows: Range (410 vs 380 vs 450 vs 340 mi), 0-60 (4.9 vs 5.6 vs 5.1 vs 6.8 s), Charge to 80% (28 vs 35 vs 25 vs 40 min), Seats (5 vs 7 vs 5 vs 5), Price ($52k vs $61k vs $58k vs $44k). Best-in-row values glow with a small trophy icon. Clean white background, electric-blue and green palette, bold headers, sharp modern typography.Mode d’emploi
- Copiez le prompt original complet, paramètres compris.
- Adaptez le sujet, le texte et la composition à vos besoins.
- Utilisez un outil externe compatible ; vérifiez l’accès et le résultat.
Avant de commencer
- Vérifiez si une image de référence est nécessaire. La compatibilité ne prouve pas le modèle utilisé pour cet exemple.
- Vérifiez noms, chiffres et textes ; les versions du modèle peuvent produire des résultats différents.