原文
GPT Image 2 · en
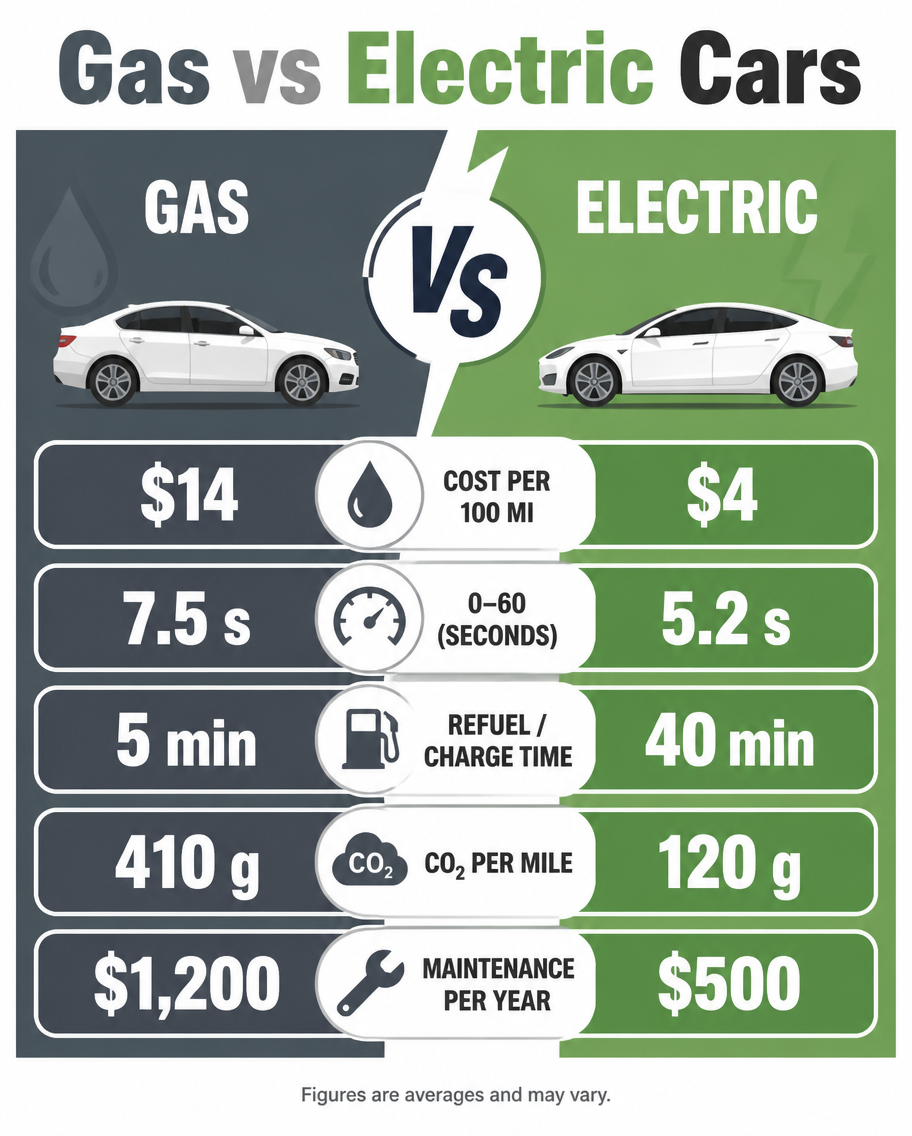
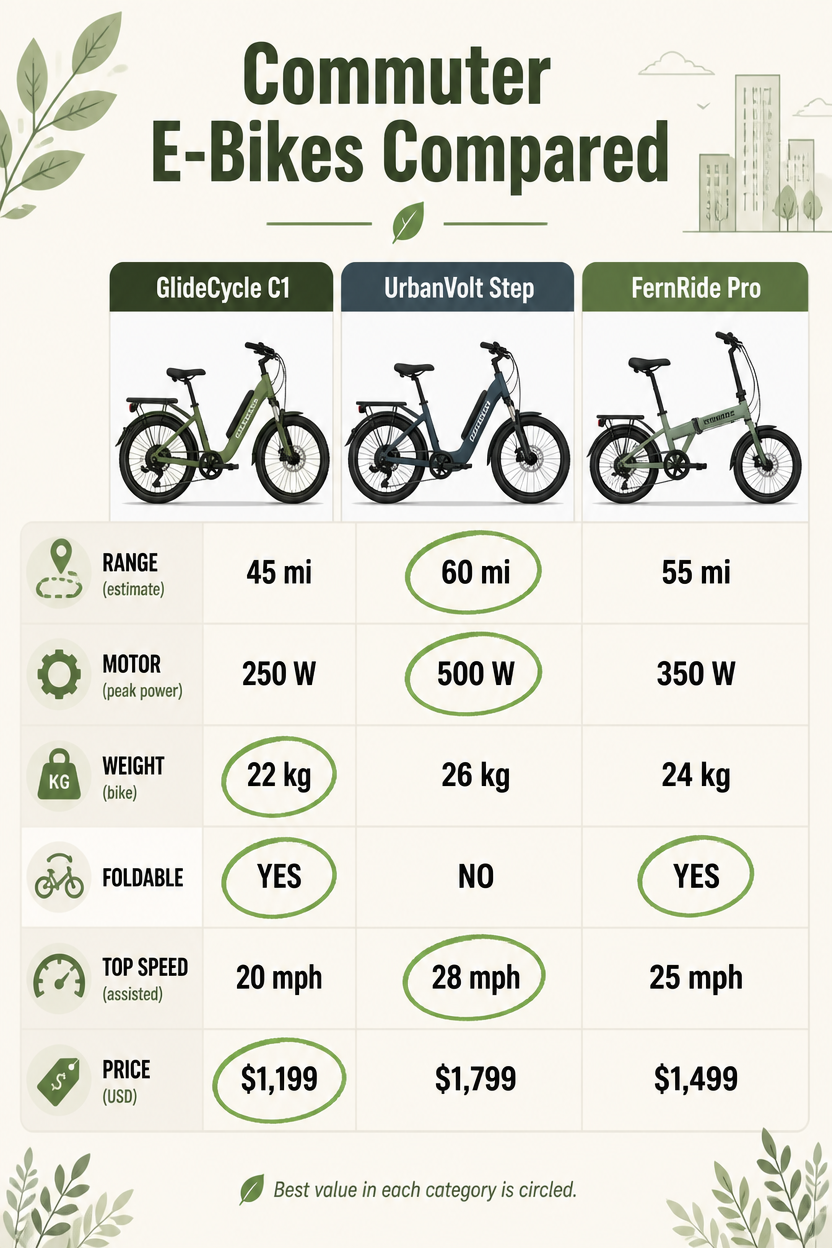
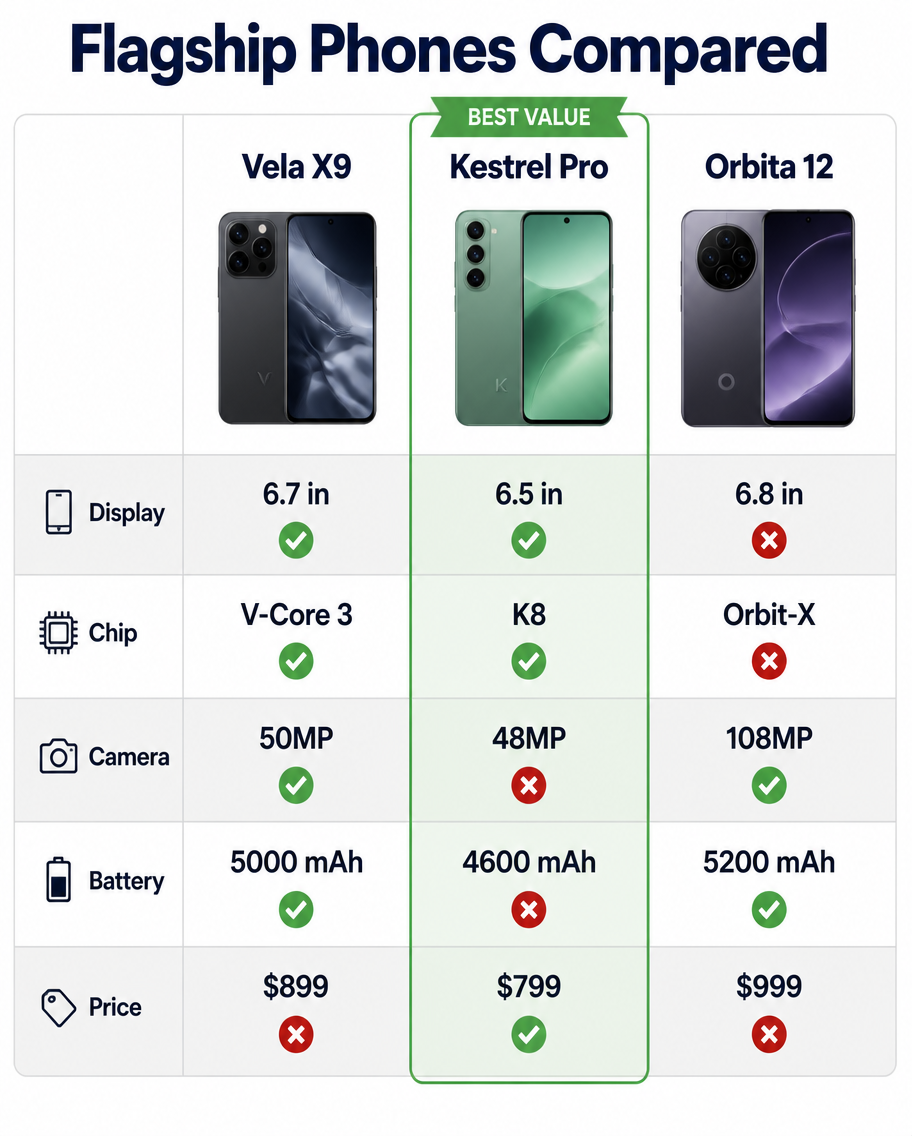
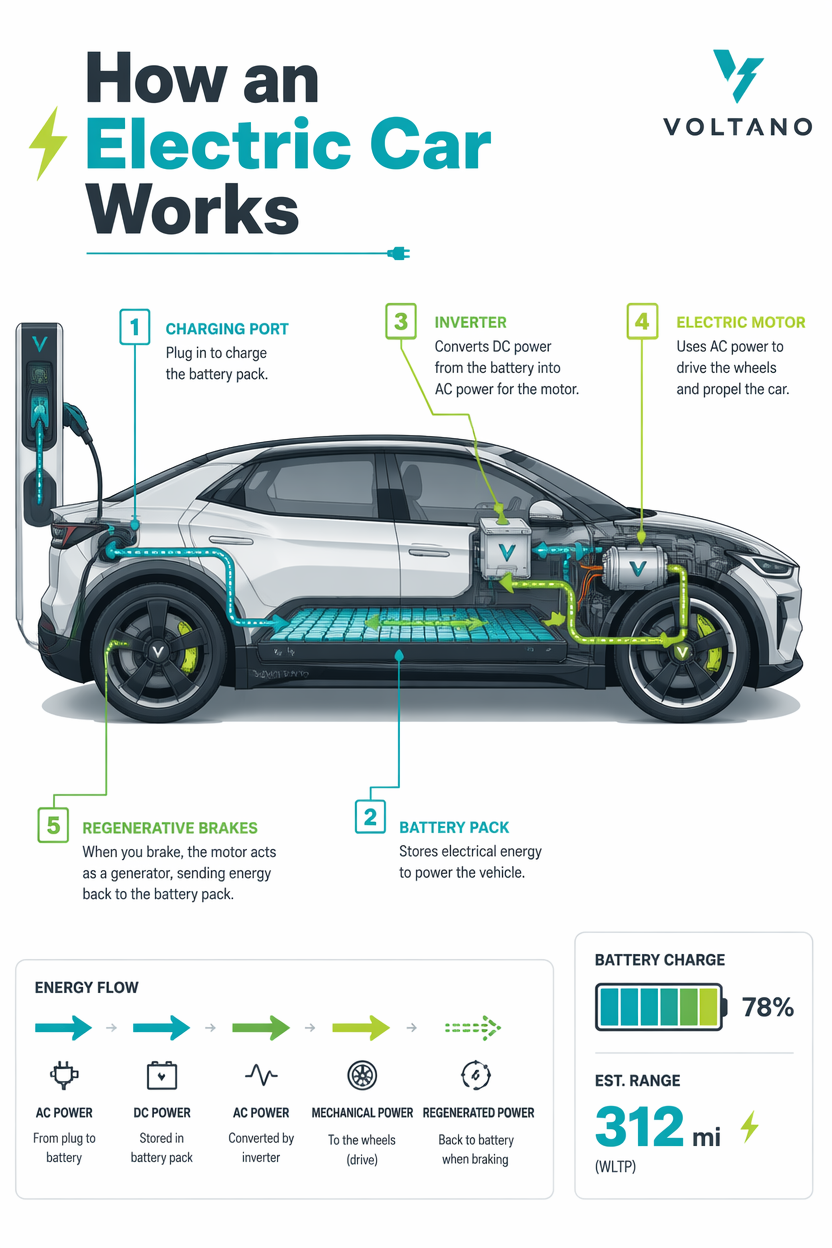
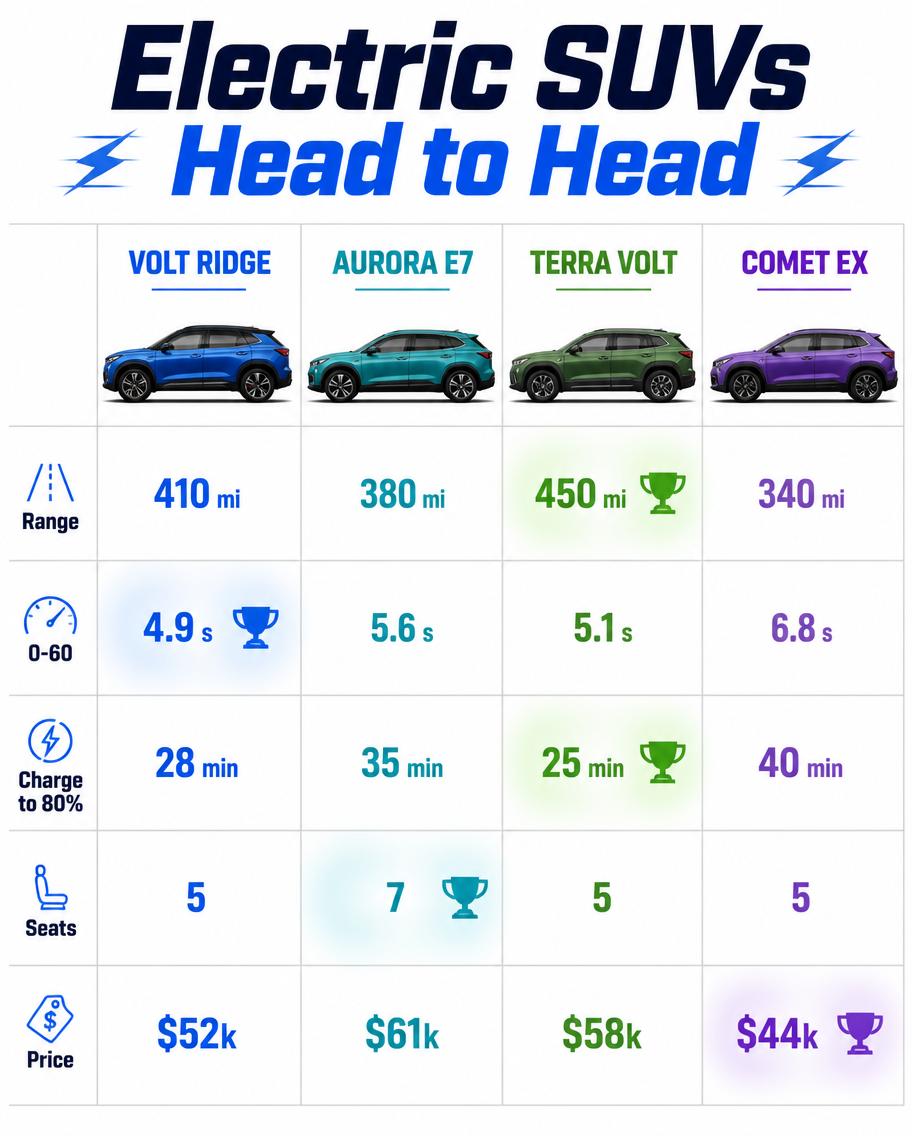
A vehicle comparison infographic, 4:5, titled 'Electric SUVs Head to Head'. A four-column table for invented EVs: Volt Ridge, Aurora E7, Terra Volt, Comet EX. Side-profile car illustrations top each column in matching accent colors. Rows: Range (410 vs 380 vs 450 vs 340 mi), 0-60 (4.9 vs 5.6 vs 5.1 vs 6.8 s), Charge to 80% (28 vs 35 vs 25 vs 40 min), Seats (5 vs 7 vs 5 vs 5), Price ($52k vs $61k vs $58k vs $44k). Best-in-row values glow with a small trophy icon. Clean white background, electric-blue and green palette, bold headers, sharp modern typography.使い方
- パラメータを含む元のプロンプト全体をコピーします。
- 被写体、文字、構図を自分の要件に置き換えます。
- 対応する外部ツールで使用し、利用条件と結果を確認します。
開始前の確認
- 参考画像の要否を確認してください。互換モデルの表示は、そのモデルでの生成実績を意味しません。
- 名前、数値、画像内の文字を確認します。モデルの版で結果は変わります。