Document original
GPT Image 2 · en
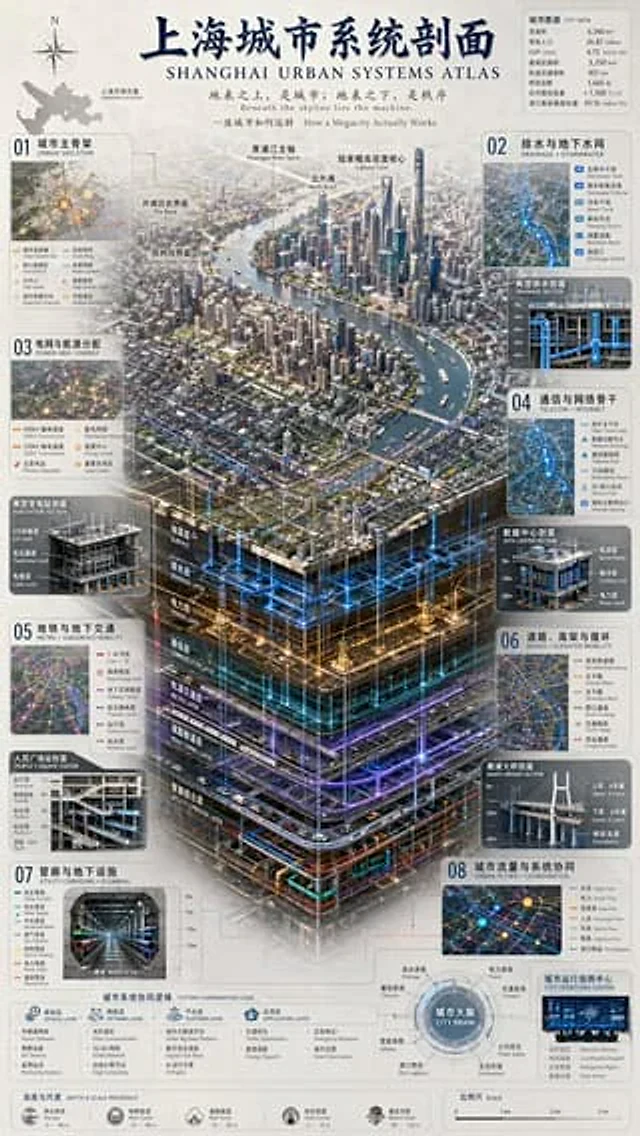
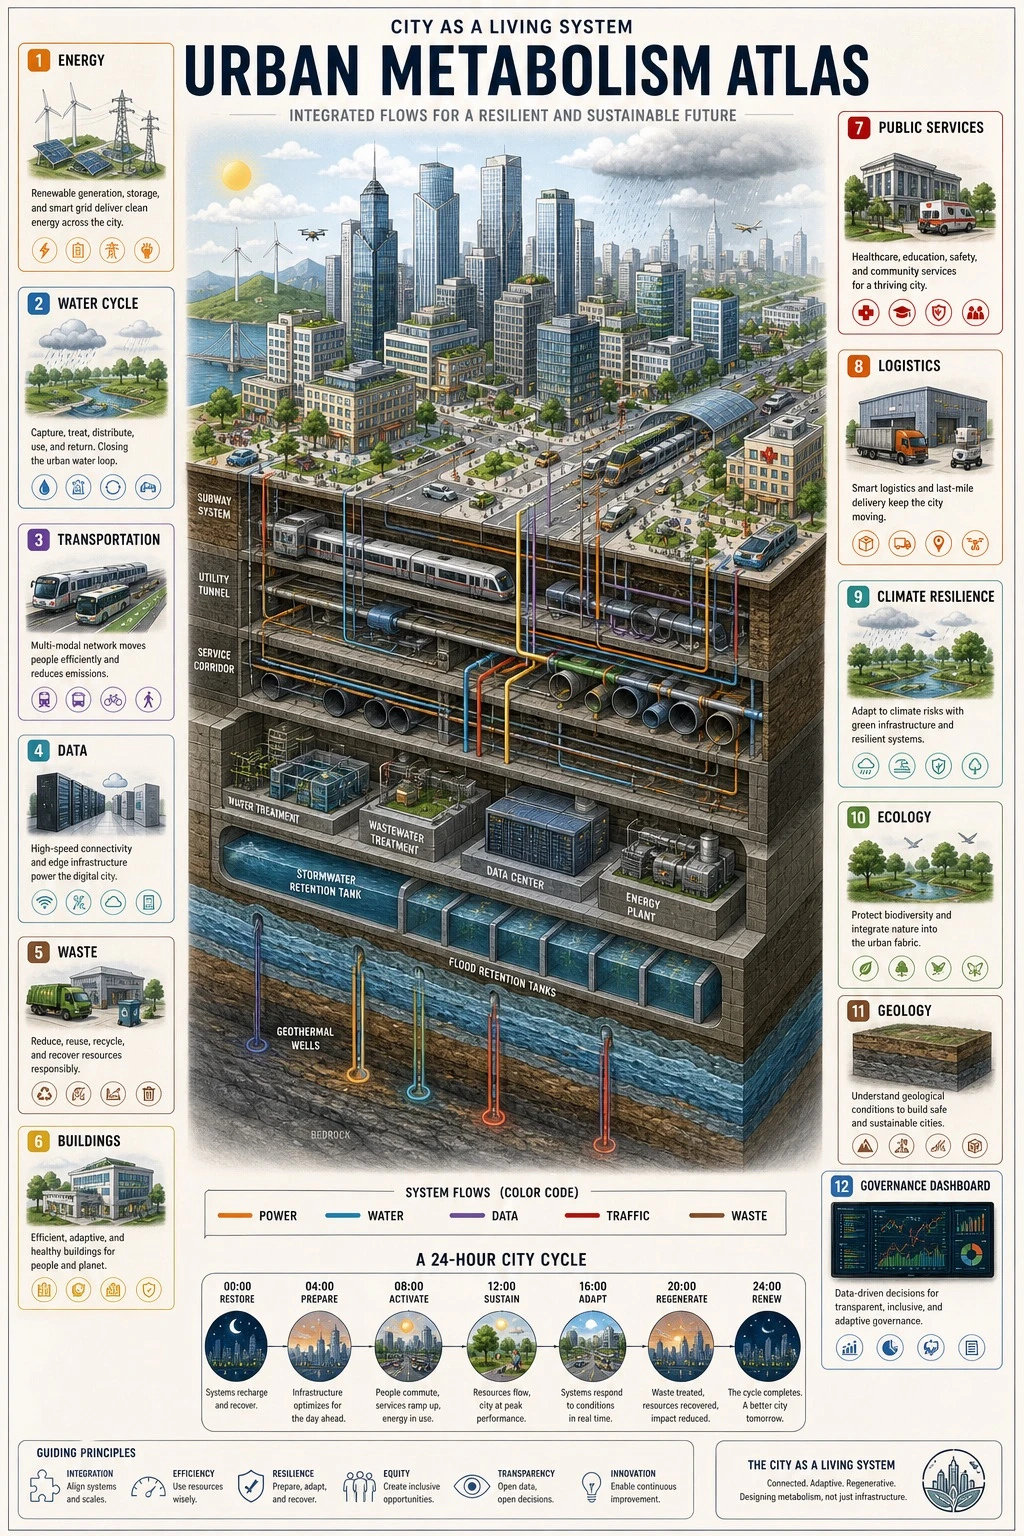
Vertical 9:16 isometric cutaway infographic titled '[DIAGRAM_TITLE]'. Depict a smart city from sky to bedrock, showing skyscrapers, streets, subway lines, utility tunnels, water/sewage/gas/heating pipes, fiber optic cables, a data center, flood retention tanks, aquifers, geothermal wells, and bedrock. Use color-coded flows to distinguish power, water, data, traffic, and waste systems. Include 12 numbered panels with labels in [LANGUAGE]: Energy / Water Cycle / Transportation / Data / Waste / Buildings / Public Services / Logistics / Climate Resilience / Ecology / Geology / Governance Dashboard. Add a 24-hour timeline at the bottom. Style: engineering white-paper diagram combined with scientific atlas aesthetics, light paper background, crisp clean lines, 8K resolution. Avoid cyberpunk aesthetics and gibberish text; the illustration must clearly show both above-ground and below-ground layers.Mode d’emploi
- Copiez le prompt original complet, paramètres compris.
- Adaptez le sujet, le texte et la composition à vos besoins.
- Utilisez un outil externe compatible ; vérifiez l’accès et le résultat.
Avant de commencer
- Vérifiez si une image de référence est nécessaire. La compatibilité ne prouve pas le modèle utilisé pour cet exemple.
- Vérifiez noms, chiffres et textes ; les versions du modèle peuvent produire des résultats différents.