Oryginalny dokument
GPT Image 2 · en
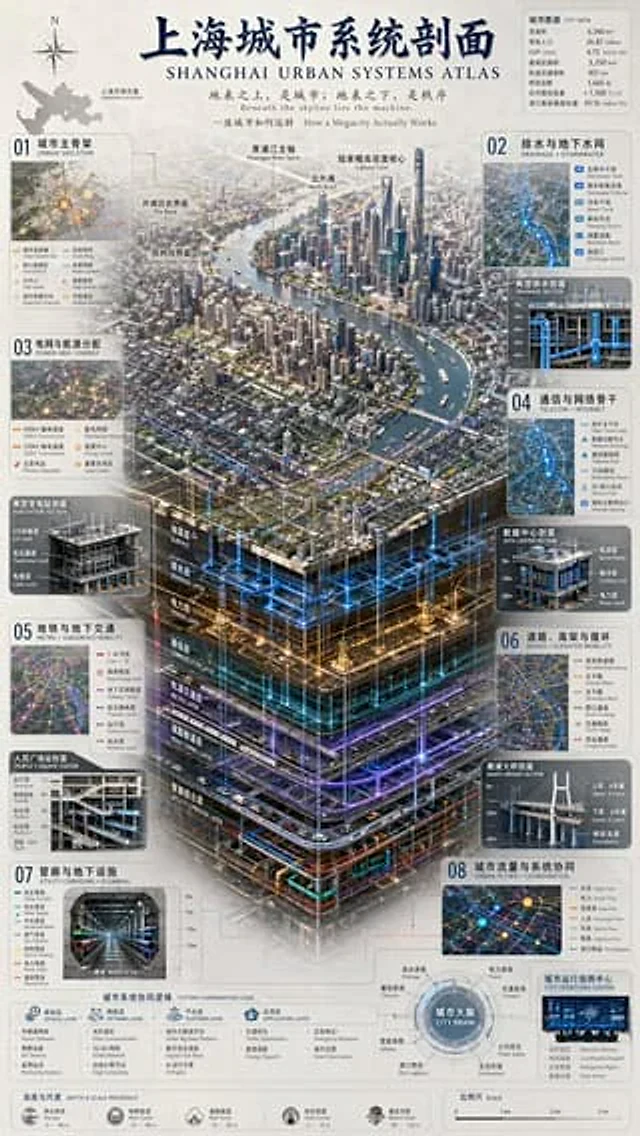
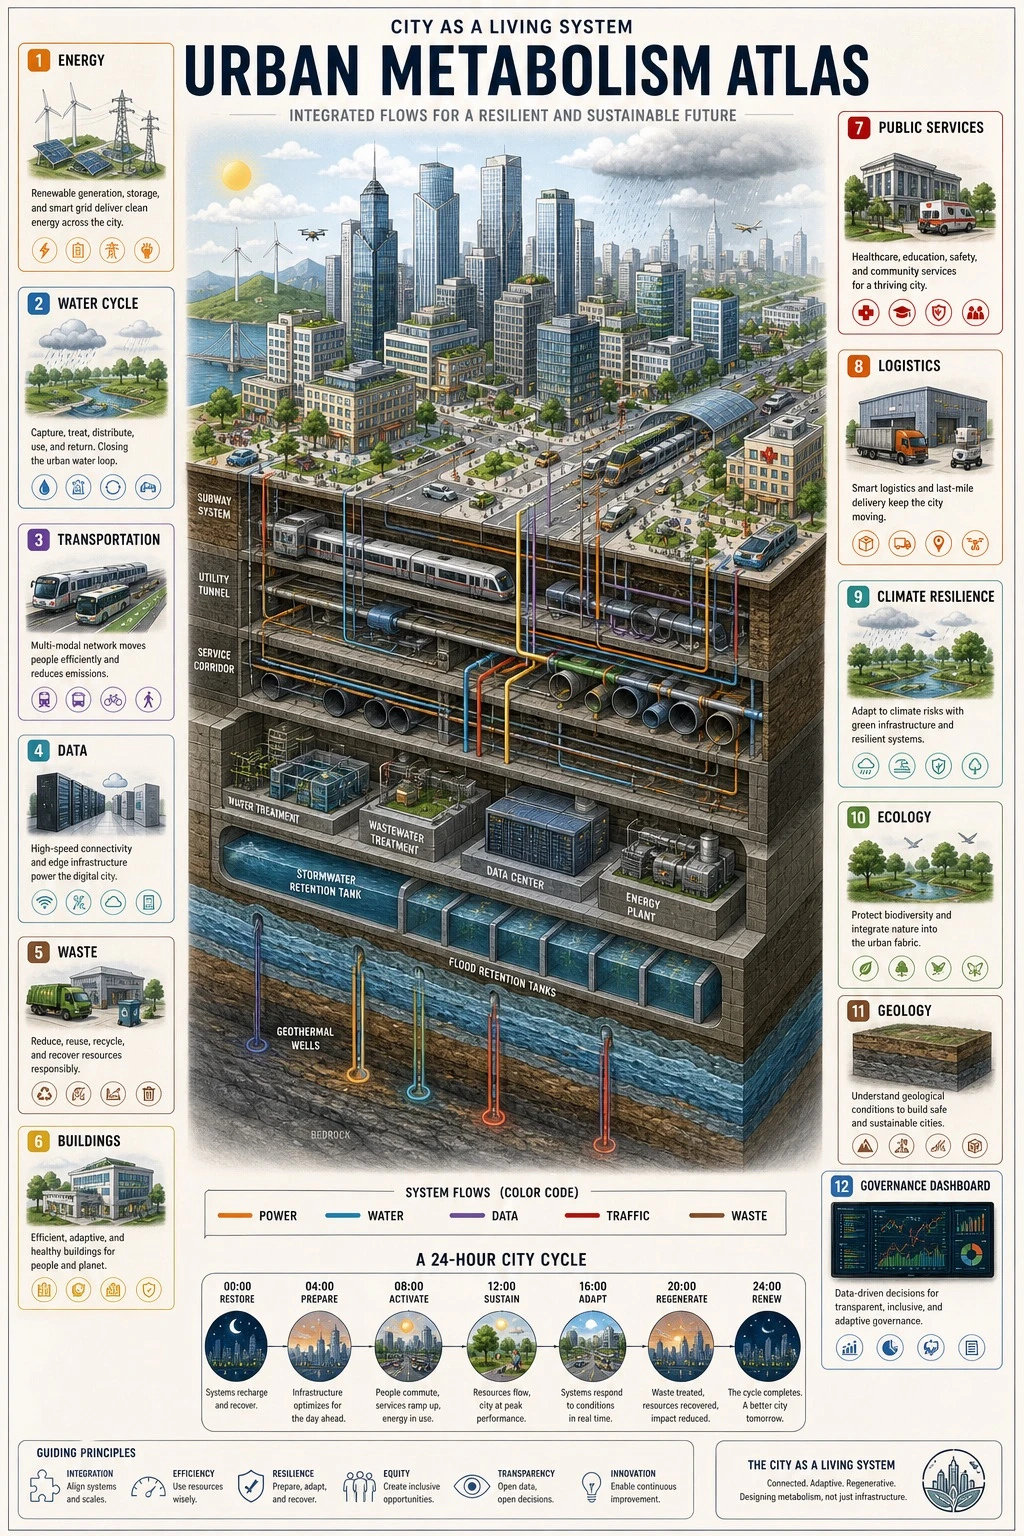
Vertical 9:16 isometric cutaway infographic titled '[DIAGRAM_TITLE]'. Depict a smart city from sky to bedrock, showing skyscrapers, streets, subway lines, utility tunnels, water/sewage/gas/heating pipes, fiber optic cables, a data center, flood retention tanks, aquifers, geothermal wells, and bedrock. Use color-coded flows to distinguish power, water, data, traffic, and waste systems. Include 12 numbered panels with labels in [LANGUAGE]: Energy / Water Cycle / Transportation / Data / Waste / Buildings / Public Services / Logistics / Climate Resilience / Ecology / Geology / Governance Dashboard. Add a 24-hour timeline at the bottom. Style: engineering white-paper diagram combined with scientific atlas aesthetics, light paper background, crisp clean lines, 8K resolution. Avoid cyberpunk aesthetics and gibberish text; the illustration must clearly show both above-ground and below-ground layers.Jak używać
- Skopiuj cały oryginalny prompt wraz z parametrami.
- Dostosuj temat, tekst i kompozycję do swoich potrzeb.
- Użyj zgodnego narzędzia zewnętrznego; sprawdź warunki dostępu i wynik.
Przed rozpoczęciem
- Sprawdź, czy potrzebny jest obraz referencyjny. Zgodność nie potwierdza modelu użytego do przykładu.
- Sprawdź nazwy, liczby i napisy; wyniki zależą od wersji modelu.