Urban Systems Infographic Layout Study — ClawLabs AI · MIT

Urban Systems Infographic Layout Study — ClawLabs AI · MIT

Original document

GPT Image 2 · en

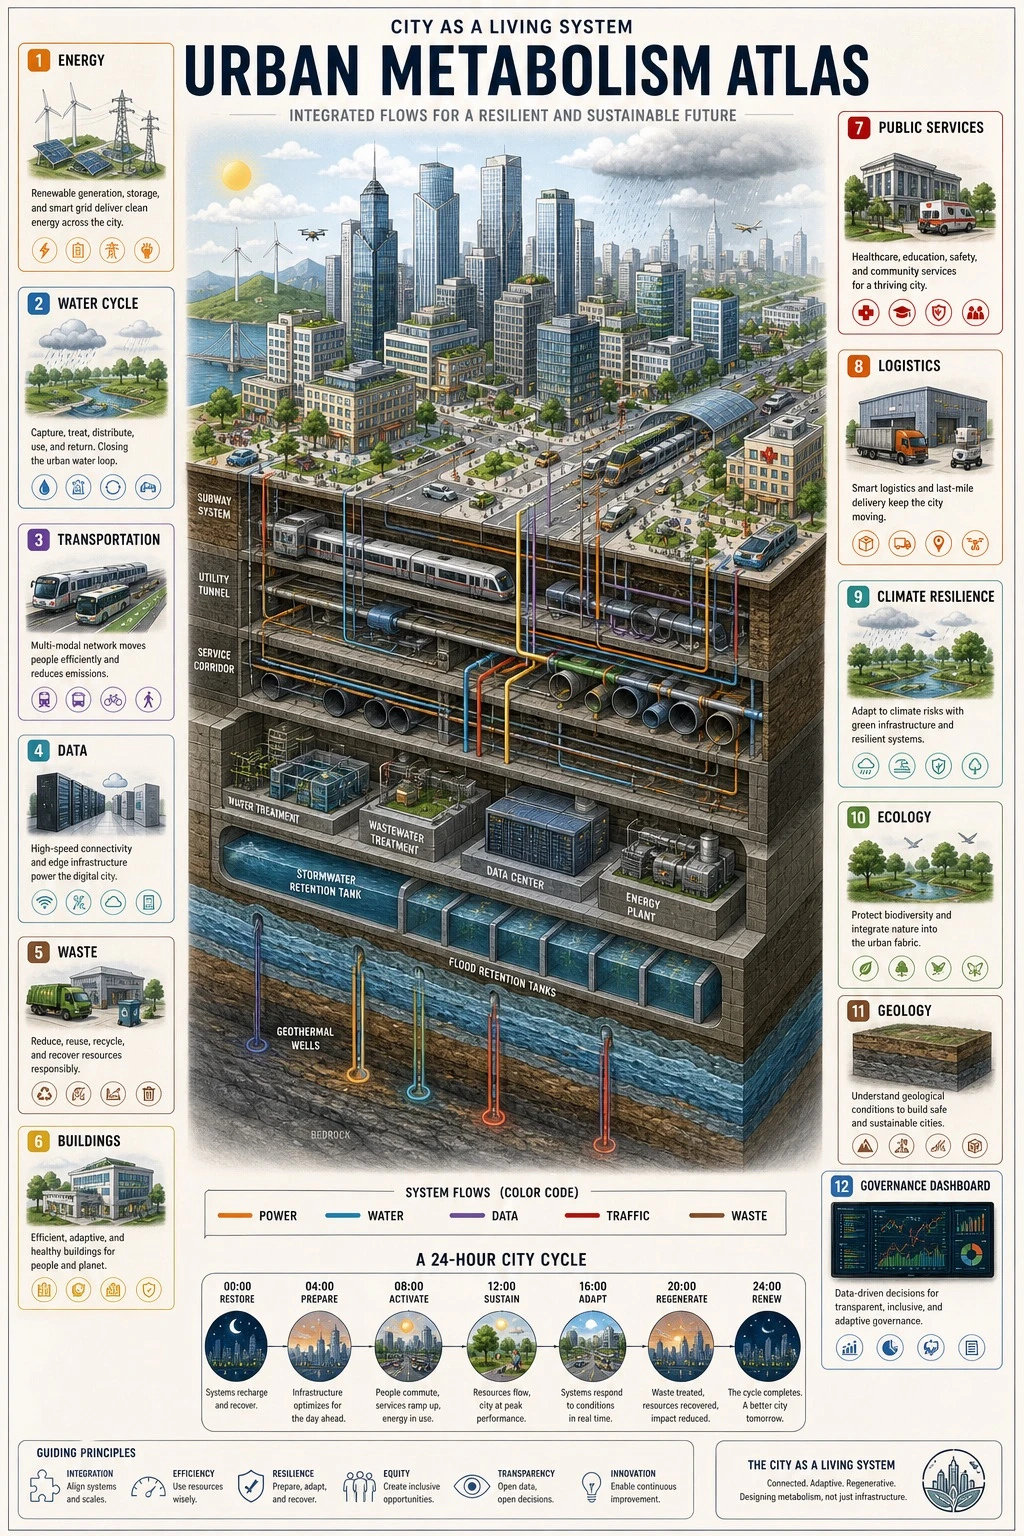
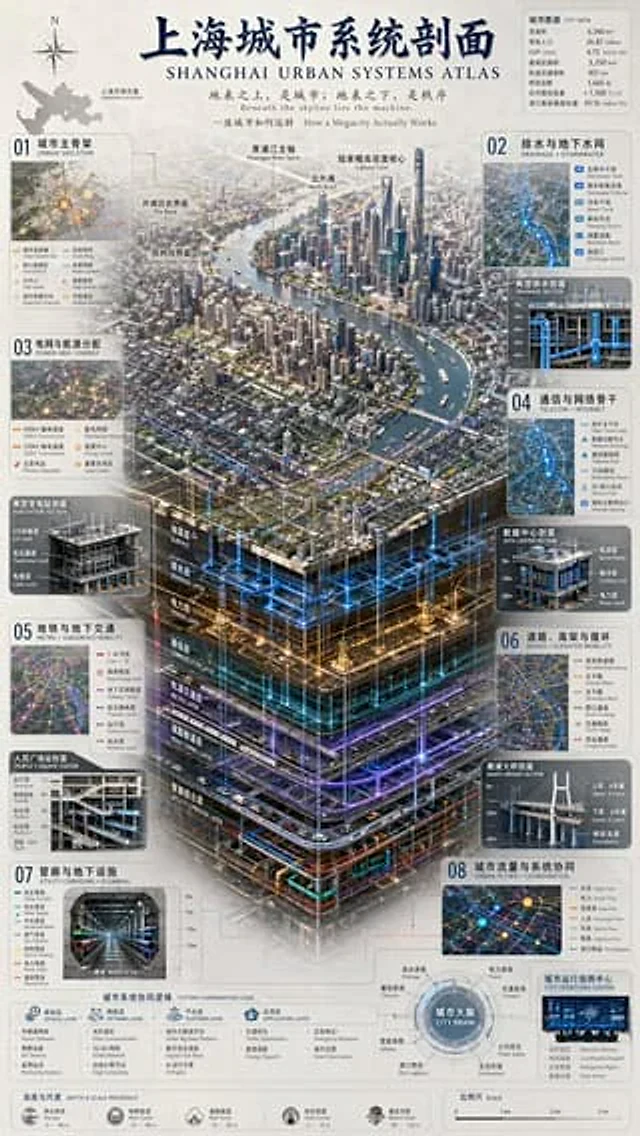
Vertical 9:16 isometric cutaway infographic titled '[DIAGRAM_TITLE]'. Depict a smart city from sky to bedrock, showing skyscrapers, streets, subway lines, utility tunnels, water/sewage/gas/heating pipes, fiber optic cables, a data center, flood retention tanks, aquifers, geothermal wells, and bedrock. Use color-coded flows to distinguish power, water, data, traffic, and waste systems. Include 12 numbered panels with labels in [LANGUAGE]: Energy / Water Cycle / Transportation / Data / Waste / Buildings / Public Services / Logistics / Climate Resilience / Ecology / Geology / Governance Dashboard. Add a 24-hour timeline at the bottom. Style: engineering white-paper diagram combined with scientific atlas aesthetics, light paper background, crisp clean lines, 8K resolution. Avoid cyberpunk aesthetics and gibberish text; the illustration must clearly show both above-ground and below-ground layers.

How to use

  1. Copy the complete original prompt, including any parameters.
  2. Replace the subject, text and composition with your own requirements.
  3. Use a compatible external tool; check its current access conditions and review the result.

Before you start

  • Check whether a reference image is required. A compatible model label does not mean this example was generated with that model.
  • Keep names, figures and visible text accurate; results can vary between model versions.
More like this

3D Urban Systems Atlas Infographic
GPT Image 2en

{ "type": "Complex Urban Systems Atlas Infographic", "style": "{argument name=\"color palette\" default=\"Dark background with luminous blue, gold, and purple accents.\"} Highly detailed technical illustrations, 3D isometric sections", "header": { "title": "{argument na

Micro Macro Infographic — Neuron Cosmic Web
GPT Image 2en

Scene: A square dark-background infographic with an elegant diagonal comparison layout. The upper-left region shows a microscope-like neural network; the lower-right region shows a cosmic web simulation aesthetic. Between them, translucent overlay lines and small non-readable sym

Chinese AI Evolution Infographic Poster
GPT Image 2en

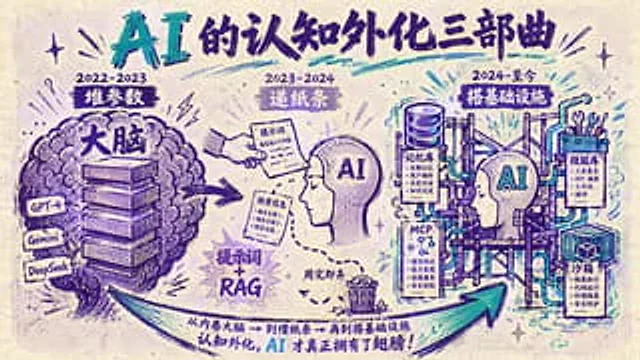
{ "type": "Hand-drawn Chinese infographic poster", "style": "Retro stencil printing magazine aesthetics, textured off-white paper background, bold calligraphy, freehand pen lines, halftone shadows, limited ink color scheme of deep purple and cyan, with slight misregistration,

China May Day Rail Travel Infographic
GPT Image 2en

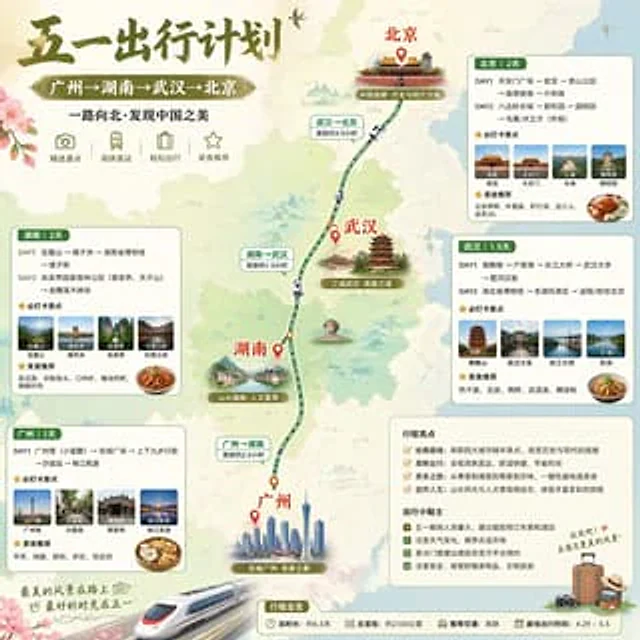
Create an exquisite Little Red Book-style infographic poster of a Chinese travel destination, employing soft watercolor map aesthetics and a square format to showcase a five-day high-speed rail travel route through China. The top left corner features a striking calligraphy title:

China Country Profile Infographic
GPT Image 2en

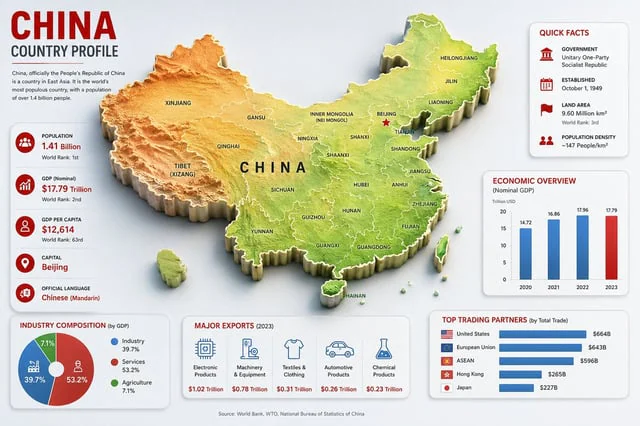
Goal: Create a clean, modern country-profile infographic for {argument name="country name" default="China"}, titled “CHINA COUNTRY PROFILE,” with a large central 3D raised relief map and surrounding statistical cards. Canvas: 16:9 horizontal infographic, light gray background, c