原文
GPT Image 2 · en
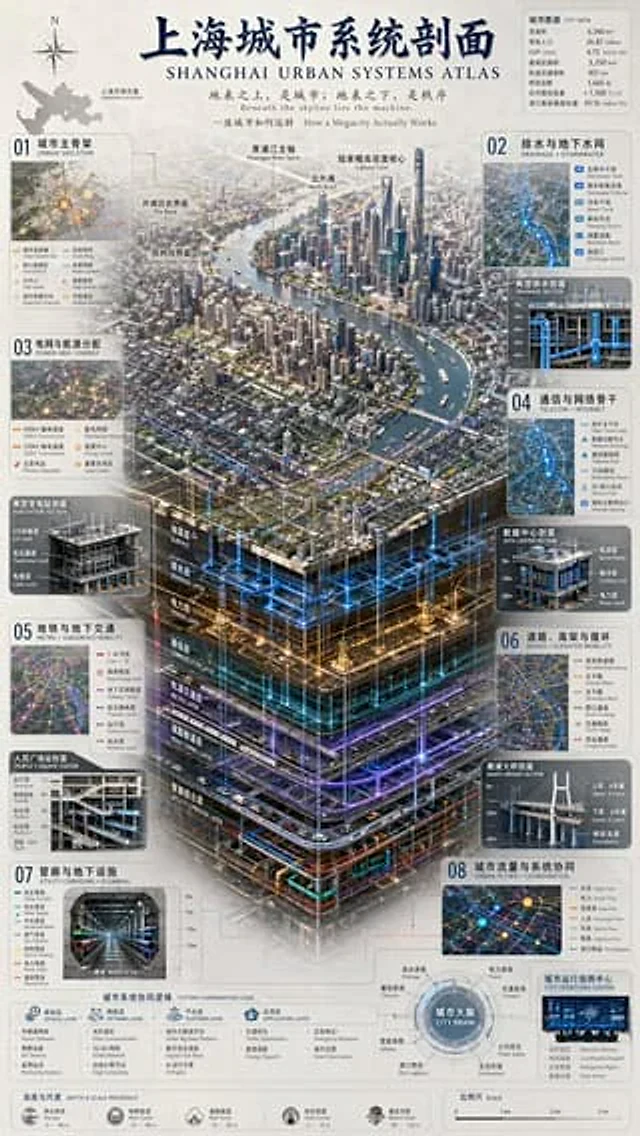
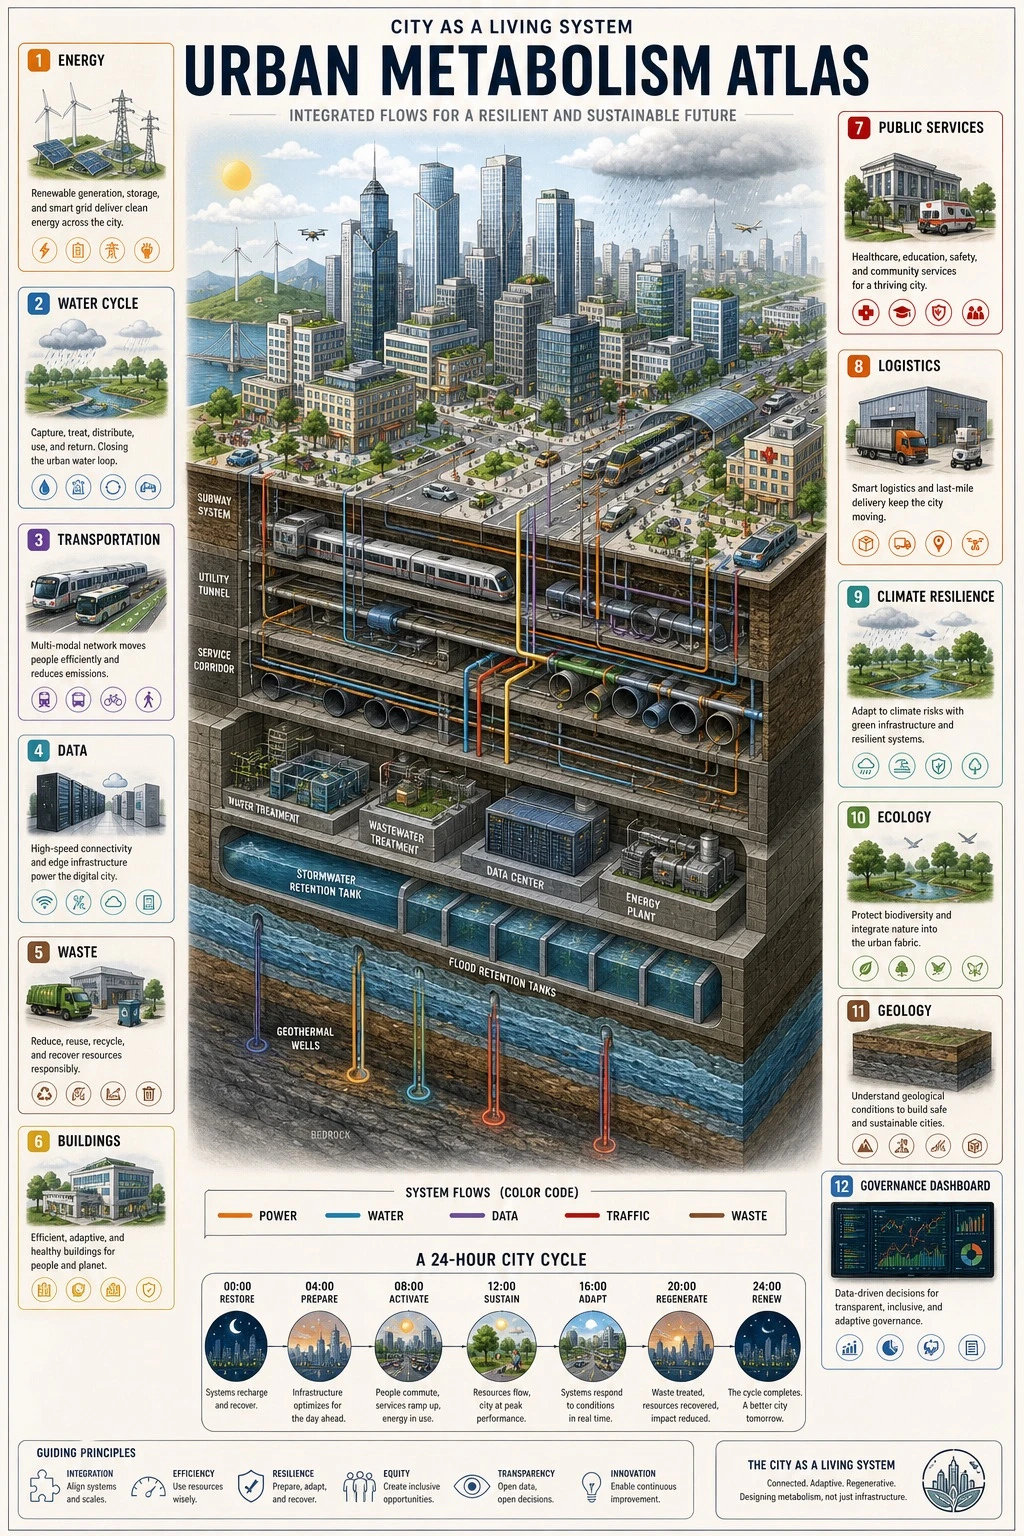
Vertical 9:16 isometric cutaway infographic titled '[DIAGRAM_TITLE]'. Depict a smart city from sky to bedrock, showing skyscrapers, streets, subway lines, utility tunnels, water/sewage/gas/heating pipes, fiber optic cables, a data center, flood retention tanks, aquifers, geothermal wells, and bedrock. Use color-coded flows to distinguish power, water, data, traffic, and waste systems. Include 12 numbered panels with labels in [LANGUAGE]: Energy / Water Cycle / Transportation / Data / Waste / Buildings / Public Services / Logistics / Climate Resilience / Ecology / Geology / Governance Dashboard. Add a 24-hour timeline at the bottom. Style: engineering white-paper diagram combined with scientific atlas aesthetics, light paper background, crisp clean lines, 8K resolution. Avoid cyberpunk aesthetics and gibberish text; the illustration must clearly show both above-ground and below-ground layers.使い方
- パラメータを含む元のプロンプト全体をコピーします。
- 被写体、文字、構図を自分の要件に置き換えます。
- 対応する外部ツールで使用し、利用条件と結果を確認します。
開始前の確認
- 参考画像の要否を確認してください。互換モデルの表示は、そのモデルでの生成実績を意味しません。
- 名前、数値、画像内の文字を確認します。モデルの版で結果は変わります。