원본 문서
GPT Image 2 · en
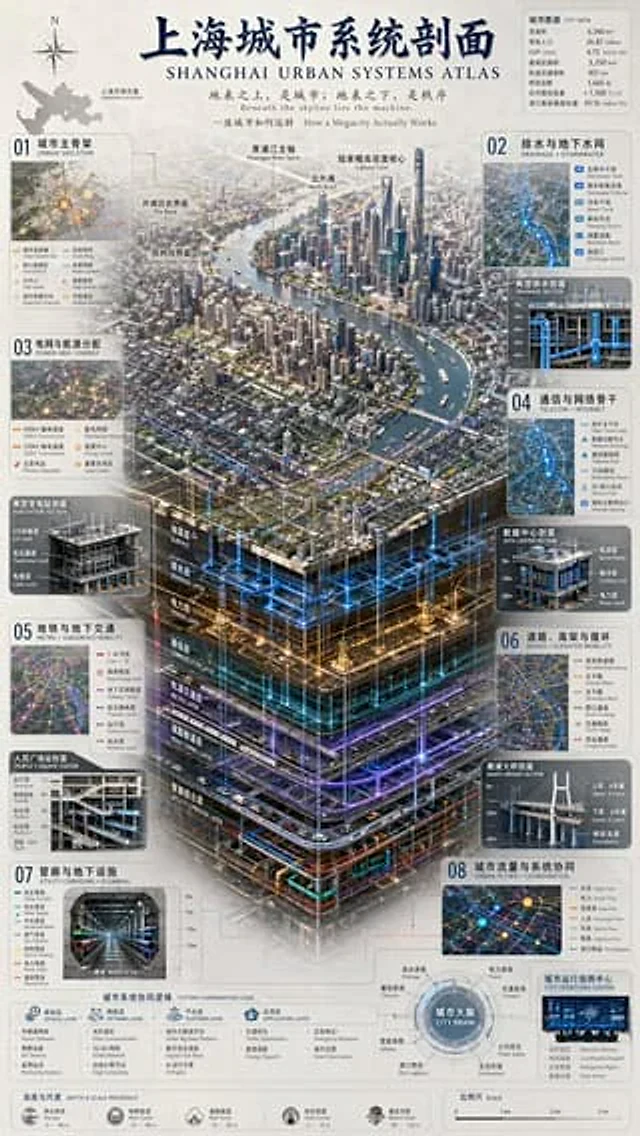
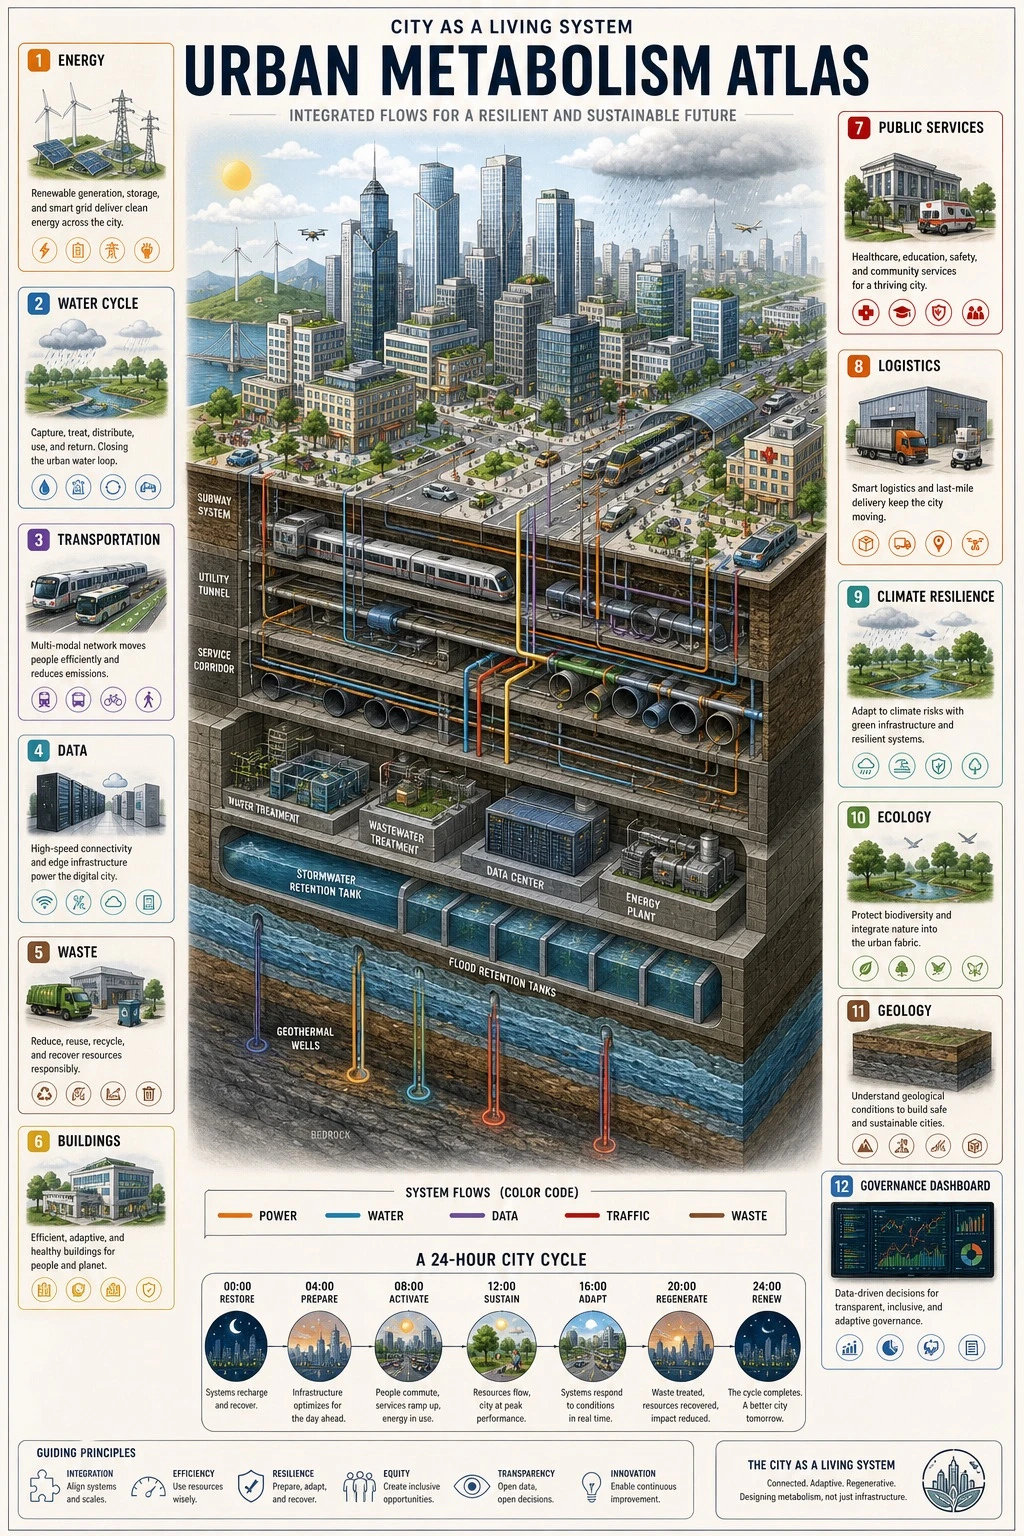
Vertical 9:16 isometric cutaway infographic titled '[DIAGRAM_TITLE]'. Depict a smart city from sky to bedrock, showing skyscrapers, streets, subway lines, utility tunnels, water/sewage/gas/heating pipes, fiber optic cables, a data center, flood retention tanks, aquifers, geothermal wells, and bedrock. Use color-coded flows to distinguish power, water, data, traffic, and waste systems. Include 12 numbered panels with labels in [LANGUAGE]: Energy / Water Cycle / Transportation / Data / Waste / Buildings / Public Services / Logistics / Climate Resilience / Ecology / Geology / Governance Dashboard. Add a 24-hour timeline at the bottom. Style: engineering white-paper diagram combined with scientific atlas aesthetics, light paper background, crisp clean lines, 8K resolution. Avoid cyberpunk aesthetics and gibberish text; the illustration must clearly show both above-ground and below-ground layers.사용 방법
- 매개변수를 포함한 전체 원본 프롬프트를 복사하세요.
- 주제, 문구, 구도를 자신의 요구에 맞게 바꾸세요.
- 호환되는 외부 도구에서 사용하고 이용 조건과 결과를 확인하세요.
시작 전 확인
- 참조 이미지가 필요한지 확인하세요. 호환 표시는 해당 모델로 이 예시를 생성했다는 뜻이 아닙니다.
- 이름, 수치, 이미지 속 문구를 확인하세요. 모델 버전에 따라 결과가 다를 수 있습니다.