Documento originale
GPT Image 2 · en
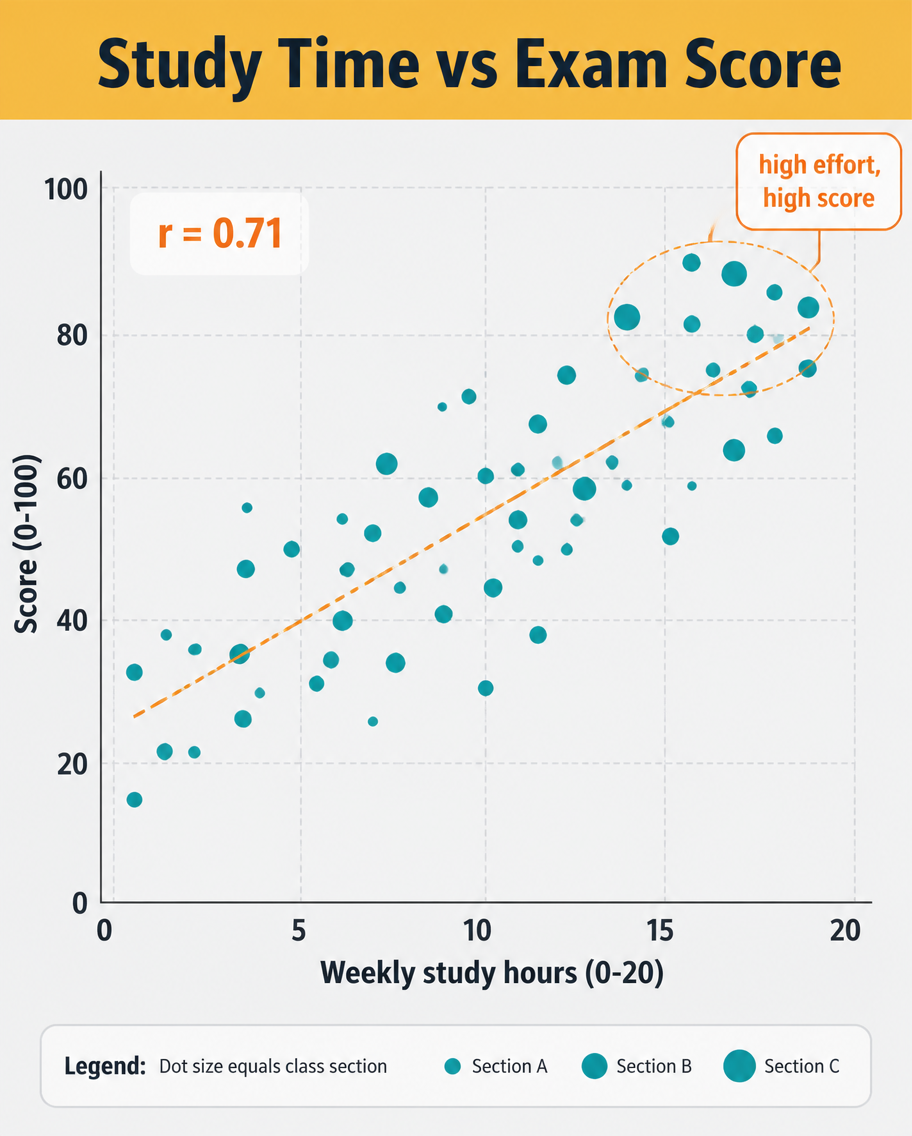
A data infographic, 4:5, titled 'Study Time vs Exam Score'. A scatter plot dominates: roughly 40 dots scattered upward-right, each a small teal circle, with a dashed orange trend line rising through them and a label 'r = 0.71'. X-axis 'Weekly study hours (0-20)', Y-axis 'Score (0-100)', light grid. A highlighted cluster near the top-right is circled with a callout 'high effort, high score'. Header on a mustard band, pale grey plot background, clean sans-serif, small legend explaining dot size equals class section.Come usare
- Copia tutto il prompt originale, inclusi i parametri.
- Adatta soggetto, testo e composizione alle tue esigenze.
- Usa uno strumento esterno compatibile; verifica accesso e risultato.
Prima di iniziare
- Controlla se serve un’immagine di riferimento. La compatibilità non prova il modello usato per l’esempio.
- Verifica nomi, numeri e testi; i risultati cambiano con le versioni del modello.